Private Colleges: Deficits and Closings
The higher education market is shedding colleges at a record pace. Despite the large influx of federal funds in 2022 to offset the effect of the pandemic (see Chart 1), fourteen private colleges closed or disappeared in mergers during the first three months of 2024. If this trend continues through 2024, there is a good chance that fifty-six private colleges will have closed their doors by December. Apparently, COVID funding may have only been a short-term reprieve for private colleges in higher education.
Chart 1 ([1])
Count of Private Colleges and Universities that Closed between 2020 and March 2024
(The blue trendline is a second order polynomial)

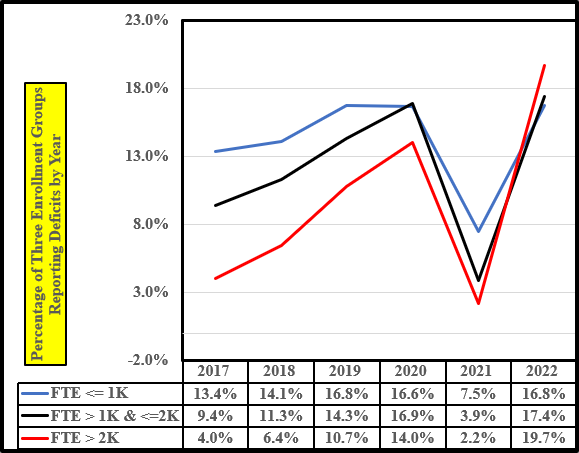
Operational deficits for the years 2017 to 2022 indicates that private college and universities were under financial stress prior to the pandemic funding, and many of these colleges are returning to a state of stress. Chart 2 shows the percentage of private colleges reporting operational deficits by year from 2017 to 2022 for three FTE (full-time-equivalent students) groups; colleges with enrollments: less than or equal to 1,000 FTE; between 1,000 FTE and less than or equal to 2,000 FTE, and greater than 2,000 FTE.
Each enrollment group had increasing percentage of deficits between 2017 and 2021 except for the smallest enrollment group. The latter group had a small decline in deficits between 2019 and 2020. In 2021, the percentage of deficits plummeted as pandemic funds reached colleges. Nevertheless, in 2022, the percentage of colleges with operational deficits shot up to their highest level. If the 2021 dip is removed, the percentage of deficits returned to the pre-2021 trend. The exception was colleges with more than 2,000 FTE, where deficits jumped to a rate higher than the other two groups of private colleges. There is no ready evidence of why this occurred; unless larger colleges were making large expenditures and had the reserves to strengthen their IT support given their experience during the pandemic.
Chart 2 ([2])
Percentage of Three Enrollment Groups Reporting Deficits between 2017 and 2022

Here are several observations derived from the Charts 2 and the following Chart 3.
- Private Colleges with enrollments less than 1,000 FTE have the most difficulty in generating positive income annually Table 1, (Charts 2 and 3).
- Annually small colleges, on average, generated a 2.5% operational deficit (Table 1). The danger sign for these colleges is that their annual operational deficit leapt to 38.5% after COVID funding (see Chart 3).
- The middle FTE enrollment groups seems to be living the life of a porpoise running above and below the surface of operational net income. Their average operational net for the five-years was 5.4% (Table 1). Yet, in 2022, 17.4% of these colleges disclosed deficits (Chart 1). This group will bear watching over the next several years.
- The largest colleges with FTE greater than 2,000 students is the most perplexing. It’s average annual net for the five-years was 6.7% (Table 1), which was only 1.3% greater than the middle group. For 2022, the annual net for large private colleges was 0.0%, which is not very spectacular. Also, this enrollment group had the largest proportions of its institutions reporting deficits in 2022 (Chart 2). One might infer that this enrollment could possibly have financial reserves to power forward despite annual deficits. Even so, if some of these large colleges assume that a series of deficits will not endanger their financial viability, they could be whistling past the graveyard.
Table 1 ([3])
Average Annual Operational Net Income for Three Enrollment Groups of Private Colleges

CHART # 3 ([4])
Average Annual Net Income for Three Enrollment Groups from 2017 to 2022

Conclusion
As is evident from the preceding table and charts, this is a perilous time for many private
colleges and universities. Survival at deficit entangled colleges will depend on strong management by boards of trustees and presidents. Difficult and often painful decisions will have to be made if an institution intends to survive. If financially vulnerable colleges fail to act in a timely fashion, they may well end up on Chart 1.
References
-
Higher Ed Dive Team ( March 11, 2024), “How many colleges and universities have closed since 2016”, How many colleges and universities have closed since 2016? | Higher Ed Dive; Higher Ed Dive Team; Higher Ed Dive. ↑
-
Financial Data, Integrated Postsecondary Education Data System (Retrieved March 2024) https://nces.ed.gov/ipeds/; ↑
-
Financial Data, Integrated Postsecondary Education Data System (Retrieved March 2024) https://nces.ed.gov/ipeds/; ↑
-
Financial Data, Integrated Postsecondary Education Data System (Retrieved March 2024) https://nces.ed.gov/ipeds/;
Originally published In StevensStrategy.org ↑