by Michael K. Townsley | May 26, 2024 | Financial Strategy and Operations, Private Colleges & Universities in Crisis
Michael Townsley, Ph.D. Senior Associate Stevens Strategy
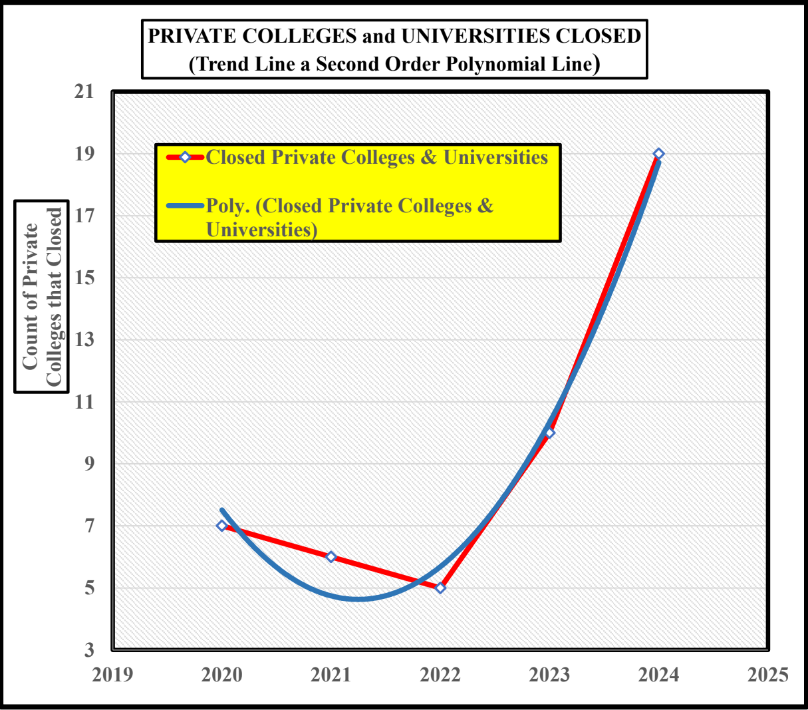
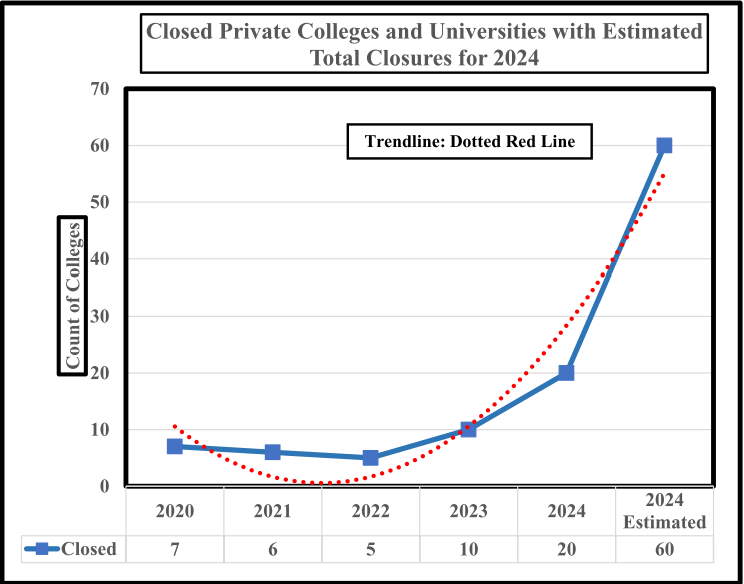
Private colleges and universities are encountering unprecedented levels of financial stress that may even exceed the financial problems caused by the Great Depression in the 1930s. According to the Hechinger Report article in April 2024, “colleges are closing at a pace of one a week. [1] Sustainability for many colleges means whether they can survive the immediate financial stresses. “Fitch ratings estimated that 20-25 schools will close annually going forward.”[2] The curve in Chart I shows the exponential acceleration of closings by private colleges in the first four months of 2024. If this pace continues through this year, there is a possibility that sixty private colleges could close.
Chart 1
PRIVATE COLLEGES and UNIVERSITIES CLOSED
(Trend Line a Second Order Polynomial Line)
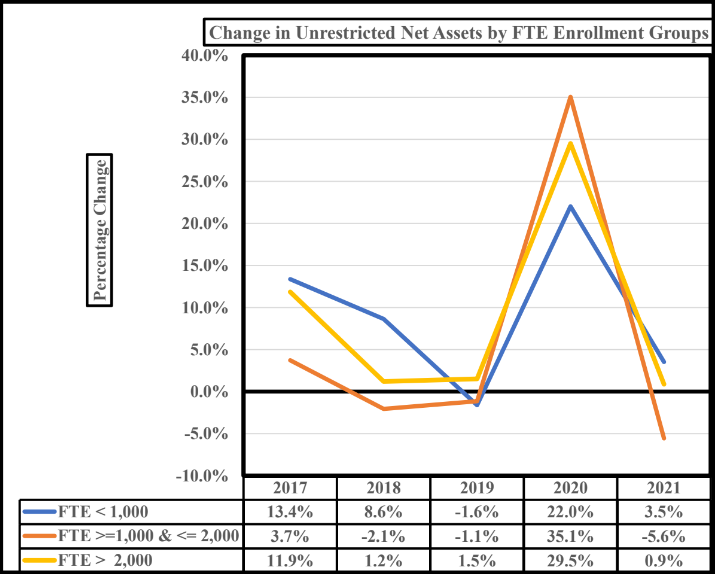
Colleges in two enrollment group in Chart 2 reported outflows of funds from unrestricted assets between 2018 and 2021. The middle FTE group of colleges with enrollments between 1,000 and 2,000 FTE students had the largest number of average unrestricted asset outflows (2018, 2019, and 2021) over the five years of the chart. These colleges in 2020, also, had the largest average inflow of pandemic funds. Nevertheless, as noted these colleges returned to negative outflows in 2021. It is interesting that private colleges in the smallest enrollment group (less than 1,000 FTE students) only dipped into unrestricted assets in 2019. On the other hand, only colleges in the largest enrollment group (greater than 2,000 FTE students) did not have fund outflows from unrestricted net assets. As Bloomberg reported in 2023, “…government aid during the pandemic helped as a Band-Aid on the long-simmering issue of dwindling enrollments, the expiration of relief [in (2024] is likely to expose …reckoning [for] dozens of colleges.” [3] Sad to say, the chickens appear to be coming home to roost.
Percentage Change
Chart 2
In order to answer why colleges are closing and exhibiting greater financial instability, this study used a Vulnerability Gauge© to predict risk, which was defined as the probability that a private college or university will or will not fail in the near future. A series of logit tests of the Vulnerability Gauge found that the most robust and parsimonious model had an 86.3% prediction rate of financial risk when these two factors were used:
- Annual percentage change in Unrestricted Net Assets over five-years (for most private colleges, these assets represent the ready financial reserves that cover operational expenses);
- The total change in FTE (full-time enrollment) over five-years.
The probabilities for each member of the sample were then arrayed into four risk bands: low, moderate, greater, and high risk of financial failure as shown in Table 2. The risk bands indicate that the lower the probability, the lower the risk of closing and the higher the probability, the greater the risk of closing. The last two rows of Table 2 include the number and proportion of colleges in each risk band. The largest percentage were concentrated in the fewest number of colleges are in the high-risk band. Time will tell if the institutions in the greater risk band move to the high-risk band.
Table 2

Chart 3 assigns colleges in the sample to three FTE groupings, FTE < 1,000; FTE >= 1,000 and
<= 2,000, and FTE > 2,000. The three graph lines show several interesting dynamics. Since 2016, the number of institutions with lest than 1,000 FTE have increased from 311 to 352, i.e., forty-one colleges. While both sets of colleges with enrollments between 1,000 to 2,000 FTEs and more than 2,000 FTE declined by forty-two colleges. This would appear to indicate that enrollment is having an unwelcome impact on those colleges that lost enrollment and move from
large or middle-sized colleges to smaller schools. Of course, lost enrollment more than likely leads to lots tuition revenue which begins to undermine Unrestricted Net Assets. The effect of lost enrollment will become more apparent as we delve into tuition discounts and unrestricted Net Assets.
Chart 3
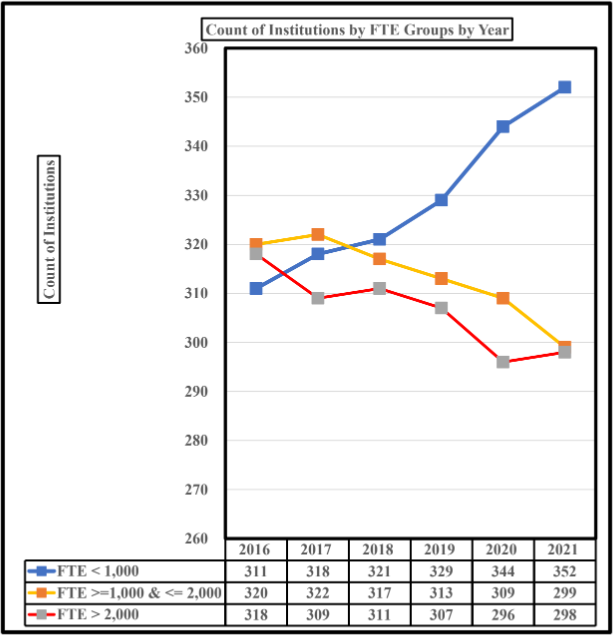
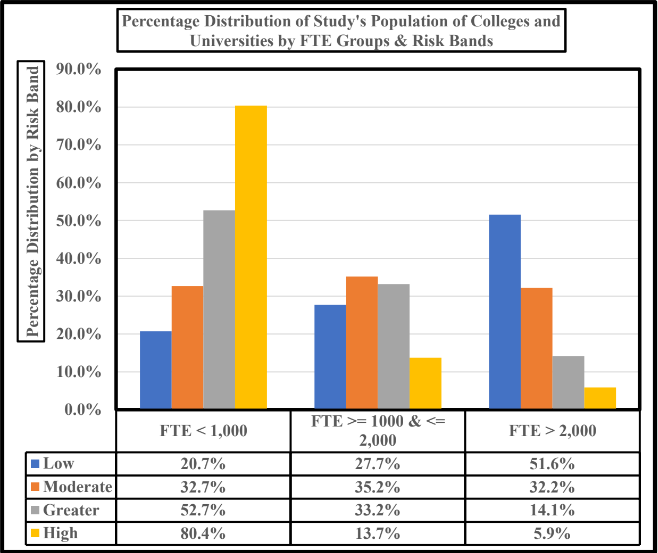
Table 3 and Chart 4 pull together the data from the Vulnerability Gauge variables. The table gives the counts by FTE groups and risk bands. This table indicates that
- Low risk institutions are concentrated in the FTE group with enrollments greater than 2,000 students. (132 colleges)
- Moderate risk institutions are closely spread across the three enrollments groups. (respectively from smallest to largest enrollment group: 131, 141, and 129 colleges)
- The FTE enrollment group with less than 1,000 has the largest number of colleges rated as greater risk. (respectively: (127 colleges)
- The less than 2,000 enrollments also have the largest number of institutions (41 colleges) rated as high risk.
Table 3
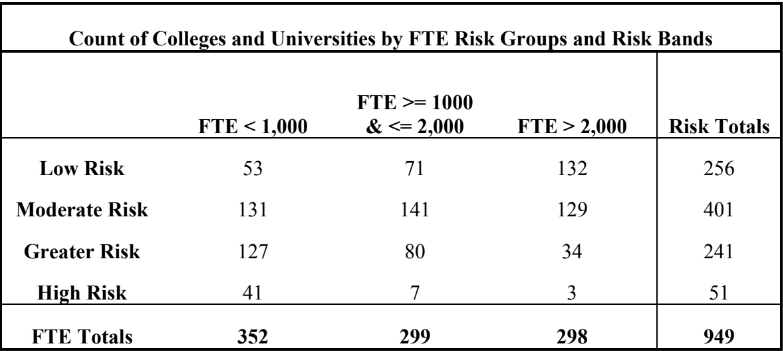
Chart 4 displays the percentage distributions for the four risk bands and risk bands. This chart clearly indicates that although the middle enrollment group has fewer colleges than the low enrollment group rated as greater risk, the percentage of the middle group is more than twice the number in the FTE group with more than 2,000 students. The near-term question is whether or not institutions rated as greater risk of failure will move into the high or moderate risk band.
Given these continuing declines in the: pool of prospective students, re-valuation of many degree majors by prospective students, coupled with the falling return-on-investment in a degree for graduates, it would not be surprising that risks will remain high and probably drive more colleges into the high-risk band.
Chart 4
Unresolved Issues
- Is the collapse of the value of Net Unrestricted Net Assets a quirk or a harbinger of more bad news for private colleges?
- Will those colleges rated as greater risk move to the high-risk category as enrollments and other factors diminish the pool of potential students?
- Will the fifty-one institutions rated as high risk in all three FTE enrollment groups move to extinction in the near-future?
- How much time do the institutions rated as high- risk have to devise a strategy and implement an operational plan to avoid closure?
- How much time do the institutions rated as greater risk have to avoid dropping into the high-risk category?
Final Comments
Higher education, in general, and private colleges and universities, in particular, as an industry faces a woeful future as slackening demand, rising costs, and excess supply of seats grinds down their financial stability. In most cases, catastrophic conditions did not suddenly appear. They have been present, more than likely, since student market demographics began their downhill slide at the start of this century. (See the Bloomberg essay, “The Economics of Small US Colleges Are Faltering”) [4]
The preceding discussion suggests the assumption that small colleges are the only institutions in danger is a false assumption. This finding of this study suggests that larger colleges can slide into the small college column. Also, the size assumption ignores that the second Vulnerability Gauge variable – Unrestricted Net Assets – that provides the pool of financial reserves to fund on-going operations of a college or university.
Two equations explicate the problem of financial stability for many private colleges and universities:
-
- Financial Stability Dynamic: shrinking student pool, rising costs, waning net unrestricted assets and small endowments
- Risk of Failure – Vulnerability Gauge Model: changes in net unrestricted assets and full- time-equivalent enrollments can increase or decrease the risk of failure.
Final comment: Time is of the essence; delaying action does not diminish the factors shaping financial risk of a college or university.
References
1 Marcus, Jon (April 26, 2024); “Colleges are now closing at a pace of one a week”; (Retrieved April 30, 2024); The Hechinger Report; Colleges are now closing at a pace of one a week. What happens to the students? – The Hechinger Report.
2 Querolo, Nic (December 13, 2023); “The Economics of Small US Colleges Are Faltering; (Retrieved April 30, 2024); Bloomberg; US Small Colleges Battered by High Costs, Enrollment Declines (bloomberg.com).
3 Querolo, Nic (December 13, 2023); “The Economics of Small US Colleges Are Faltering; (Retrieved April 30, 2024); Bloomberg; US Small Colleges Battered by High Costs, Enrollment Declines (bloomberg.com)
4 Querolo, Nic (December 13, 2023); “The Economics of Small US Colleges Are Faltering; (Retrieved April 30, 2024); Bloomberg; US Small Colleges Battered by High Costs, Enrollment Declines (bloomberg.com).
by Michael K. Townsley | May 26, 2024 | Governance, Strategic Planning
Michael Townsley and Robert DeColfmacker
By May of 2024, twenty private colleges have closed or announced that they are
closing. If this pace continues, sixty private colleges could close by the end of 2024. Before these colleges fall into oblivion, little is heard from the boards, and it seems that the college takes action that is too little and too late. The boards of these schools don’t
seem to be governing strategically nor are they looking at operational trends but seem to be reacting to immediate crises.
Even in the best of times, you would think that some board members would have the acumen to wonder what is happening at the college. Maybe they assume that the reports that they receive tell the whole story. Nevertheless, if they are doing their duty, they
should be receiving an annual audit report by an independent auditor and meet with the auditor without the presence of the president. Receiving reports and asking trenchant questions are two different matters.
Shouldn’t boards want to know what the trend has been for key economic drivers such as enrollment, tuition discounts, tuition, and net auxiliary revenue? Moreover, wouldn’t they want to know if there are adequate cash reserves to cover annual cash flow needs?
This information is readily available from audits, basic enrollment reports, and tuition revenue, tuition discounts, and net revenue and should be provided by the president as annual reviews of college’s operations.
The issue is given the parlous state of finances at many private colleges, why are boards not more assertive in demanding information, especially trending operational data.
Here are several possible explanations from our consulting and career experience.
- Sometimes board members see their role as mainly ceremonial and are not expected to actively oversee operational and strategic performance.
- Board may be risk averse because they don’t understand the academic programs, operations, or the role of the faculty.
- Sometimes board members don’t have sufficient business or organizational experience to help gauge school performance.
- Often, board members defer to a wealthy donor and possibly to other members with a dominant personality or to those with longer board tenure.
- Trustees sometimes defer to the president to provide and explain reports and do not depend on the president to explain more nuanced and granular details
beyond the basic reports.
- Boards also assume that presidents hire chief administrative officers with the
skills to do their jobs. However, if the president is mediocre, they will surround them selves with mediocre administrators.
- Sometimes board members don’t even read the reports and reports are not received in a timely fashion.
- Most boards have an executive committee but don’t meet with the auditor
outside the presence of the President to get a more nuanced, professional and candid assessment of the college’s true financial position.
- Board members may not have adequate time or skills to read accrediting reports, other significant internal documents or understand trends in the higher education marketplace.
- Boards are not properly trained in their basic legal and fiduciary responsibilities.
- And often boards aren’t provided, nor do they seek out information on the strategic position of the college in the market.
- After a board brings in a turnaround specialist, too often the next president that they hire does not maintain the momentum of the turnaround strategy and
returns the college to the brink of failure.
This is not an exhaustive list of the reasons that boards find themselves in the difficult and troubling situation of having to vote to close an institution. There is one common
thread at colleges that at the brink of closing: these boards have not truly governed. We are in turbulent times of shrinking student markets, declining acceptance by prospective students of the need for a degree, continuing inflationary pressures on operational costs, deteriorating prestige of college brands, and diminishing skills of college graduates. If private colleges intend to survive in these uncertain times, board members need to be
more than passive seat holders.
by Michael K. Townsley | May 26, 2024 | Economics and Higher Education, Financial Strategy and Operations
Pricing Power and Private Colleges and Universities
As of the first week of May 2024, Chart 1 shows that twenty private colleges have closed with a simple factorial estimating that sixty will close. The sharp exponential growth for 2024 does not bode well for many private colleges that are struggling to survive. Presidents and Boards of Trustees need to be cognizant of how tuition pricing decisions using ever-increasing tuition discounts to offset higher tuition prices can lead to contradictory or even unwanted effects on student decisions to enroll.
Chart 1
Current Financial State of Private Colleges and Universities
This paper now turns to what has happened with tuition pricing and the unintended consequences of those decisions over the past five years. Chart 1 and Table 1 adduce a major problem that has risen from tuition pricing decisions made by leaders of private colleges and universities. Chart 1
shows since 201: modest tuition and fee increases per FTE (full-time-equivalent student), an upward trend in average tuition discounts per FTE, and negative change in net tuition per FTE.
Dollars
Chart 1 indicates that the average net tuition per FTE crossed the average tuition discount in 2019, which suggests that from 2019 onward tuition discounts were exceeding the value of any changes in tuition and fees. If the past is a prelude to the future, more than likely tuition discounts will continue to increase after 2021. Because tuition discounts are unfunded by grants or endowment, they dot yield any cash benefit when they are increased. Unfortunately, tuition discounts diminish the amount of cash available to support on=going operational cash and force a college to draw cash from its unrestricted reserves.
Chart 2

Table 1 shows the five-year change from 2017 to 2021 for tuition revenue, tuition discounts, net tuition revenue, and FTE enrollment. Although tuition discount was up 31.3%, FTE enrollment only grew 5.1%, while net tuition revenue fell 11.7%. Negative net tuition revenue means that there is less cash flowing from tuition revenue to support on-going operations. It is not unreasonable to conclude that these conditions contributed to an accelerated pace of private college closings. Based on closing data as of May 2024, the number of private colleges that closed was 100% higher than for calendar year 2023 and 150% greater than the average number of closings from 2020 to 2023.
Table 1

The failure of the tuition discount strategy to increase enrollment enough to offset lost revenue and cash has and will make it more difficult for presidents and boards of trustees to regain financial stability at many financially weak colleges. This paper uses basic economic theory to explain what shapes financial outcomes as colleges try to resolve their unstable financial conditions tuition and tuition discounts.
Conundrum of Tuition Pricing for Private Colleges and Universities
Before we start the discussion of tuition pricing, it would be useful to define several of the commonly used terms involved in tuition pricing and used to discuss tuition pricing decisions.
- Posted tuition and fees is the amount announced to the public for tuition and fee charges.
- Tuition and fee revenue is the amount of revenue received by the college from a student for tuition and fees; this figure is recorded in the accounting books and budget reports.
- Tuition discounts is an unfunded institutional grant that offsets a tuition and fee charge; these grants are recorded as expenses.
- Net price that the student pays after deducting institutional grants.
- Net price revenue is the net revenue recorded in the books that is paid by the student.
This paper uses basic micro-economic theory to explain tuition price setting. Theory posits that there is a price point where demand for a product or service and supply of that product or service are in balance. In balance means that at the price point the market for the good or service will be produced and purchased.
For private colleges and universities, demand is represented by a pool of students who file applications to one or more colleges. Supply comprises the colleges who offer enrollment in their majors to the student pool. Colleges competing for students are delineated by the choice set, which becomes evident when students file their applications. Therefore, the marketplace encompasses the student pool and their choice set of colleges. It is in this marketplace where the decision to enroll is at the intersection of the willingness of a student to accept and the price offered by a college.
Acceptance of an offer at a specific price is not necessarily at the tuition price advertised by the college. Typically, students and college agree on a net tuition price that is the amount the student owes after deducting a tuition discount. From the posted tuition. The discount is unfunded, that is, it is not supported by endowment funds. Since a tuition discount is unfunded, the college charges the discount to expenses and does not receive offsetting cash. However, a student may receive government grants or be awarded endowed scholarships that help a student pay for their net tuition balance.
Tuition pricing decisions is not simply a decision to accept a student at a given price, the college should take into account the price elasticity of the student pool, i.e.; student market. Price elasticity states that changes in price can have either a positive or negative effect on demand.
Elasticity generally operates as follows.
- If a market is elastic, price increases or decreases can have a significant effect on demand.
- If a market is inelastic, then price increases or decreases has little effect on demand, the demand.
- The price elasticity is: percentage change in quantity to the percentage change in price.
- If price elasticity is greater than 1, then price is elastic.
- If price elasticity is less than 1, then price is inelastic.
- If price elasticity is perfectly elastic; i.e.; a score of 0 or very near zero, then changes in price yield no changes in demand.
- Because elastic or inelastic markets can have a significant impact on the amount of product or service demanded, price elasticity can necessarily have an effect on revenue generated from sales.
Given the preceding statements on price elasticity and in the particular case of student demand, elasticity can have the following effects on tuition decisions:
- If the student market is elastic, then posted and net tuition increases or decreases can have a significant effect on the prospective student’s decision to enroll.
- If the student market is inelastic, then posted and net tuition increases or decreases has little effect on the prospective student’s decision to enroll.
- If the student market is perfectly elastic, then posted and net tuition, changes have little effect on the decision to enroll. (note reference for the preceding discussion can be found the Lumen Learning website).
Because price elasticity can have a positive, negative, or no effect on the decision to enroll, it follows that elasticity will directly affect tuition, net tuition revenue and the cash that flows from net tuition revenue.
Student Markets and Elasticity as of 2021
Now let’s turn to what the most recent data says about price elasticity in higher education and its impact on demand. Table 1 gives the price elasticity for three FTE enrollment groups (less than 1,000 FTE, 1,000 to 2,000 FTE, and more than 2,000 students). Price is inelastic in each group, which suggests that changes have little or no effect on enrollment decisions.
Table 2

The next table has the elasticity score and type for four risk rands. Each risk band (low, moderate, greater, and high-risk bands) represent a probability that estimates the chance of closing in the near future. The score range runs from 0.0 to 1.0 probability of closing for all four risk bands. All four bands are inelastic, as it was with the three FTE groups in Table 2.
Table 3

The elasticity scores of these two tables imply that tuition discounts will not generate sufficient net tuition revenue to offset the expense of the discount. Chart 3 illustrates the problem that the average private college must consider the impact of price elasticity when setting values for: posted tuition, tuition discount, enrollment forecasts, and budget revenue estimates. The charts indicate the average five-year changes in tuition revenue, discounts, net tuition revenue, and FTE enrollment as follows: tuition revenue was up 7.4%, tuition discounts grew 31.3%, net tuition revenue shrunk 11.7%, and FTE enrollment increased 5.1%.
As the preceding discussion on elasticity posits, and given that the average college is price inelastic, it should not be surprising that the average college did not generate enough new student revenue to offset the cost of the tuition discount.
The findings on elasticity and net tuition revenue suggest that tuition discount strategies are not the way to go, if a president and board want to avoid joining the colleges in Chart 1 that have fallen off the cliff. Other places where the leadership could focus its efforts would be: cost cutting, new programs, merger, and not waiting until the last minute to solve their financial problems. If there is one aspect that many closed colleges have in common is that they waited too long to figure out a new strategy. Another common mistake among presidents in looking for solutions is that they talk with other presidents who have the same problems and also do not have workable ideas to stop the rush to the edge of the cliff.
Chart 3

There is one last note about pricing and that is pricing power in the marketplace. Pricing power is evident when a specific institution can set the posted and net tuition price and other college follow in their pricing strategies. Those institutions would be called price makers. While the price follower institutions are called price takers. The later have very little control over their pricing strategies. The price taker must like the above comment about inelastic pricing failures over the past five years, must focus over other areas to improve their capacity to compete and survive in the higher education market.
by Michael K. Townsley | May 26, 2024 | Private Colleges & Universities in Crisis, Strategic Planning
Zombie Colleges are the walking dead of private colleges. They have: no cash, cannot make payroll, pay bills or debt services, violated their debt covenants, and only a few faculty who work for nothing. [1] The Sisyphean hill for these colleges is very high and difficult to climb
because they often have lost their accreditation. Yet, they still try to recruit students. Zombies are the classic example of ‘caveat emptor’.
The simplest way to find Zombies is to look for private colleges that have reported negative unrestricted net assets (the assets that hold mostly funds for on-going operations – payrolls, payables, debt service).
Table 1 is a five-year report on Zombies with 2021 as the last year. There were nineteen
colleges reporting negative unrestricted net assets over the five-year period. Eleven of those
colleges had a negative change in enrollment for the period. There price elasticity was less than one, which means that changes in tuition discounts had little or no effect on enrollment. For
those colleges to get any increase in enrollment, they had to offer a tuition discount of 81.8%. So, if they did have increased enrollment, those colleges only received 20 cents in cash from a dollar of tuition revenue. These huge discounts explain why they were not able to escape their
doomsday collapse.
Table 1
| Zombie Colleges – Five Year Report |
| Negative Unrestricted Net Assets for 5 years |
Elasticity for Last Year |
Tuition Discount for Last Year |
Negative Change in FTE for 5 Years |
| 19 |
0.41 |
81.8% |
11 |
The nineteen colleges were diving into Zombie oblivion at a time when the government dropped huge piles of pandemic largess to keep colleges alive. Well, they may not be alive, but they are
still there despite being Zombies bringing in students and providing unknown educational services for them. These colleges cannot survive long on a no cash and no accreditation
regimen. Typically, the end comes when the U.S. Department of Revenue no longer permits the college to issue federal financial aid to students. Then the Zombie colleges joint the Zombie
march to the Zombie Cemetery singing – Ha! Ha! Ho! Ho! Here we go to haunt our Lemming friends as they follow us to the Zombie Boneyard!
Reference
1 Quintana, Chris (I May 9, 2024) (Retrieved May 10, 2024);” Zombie Colleges? These universities are living another life online, and no one can say why”; USA Today; Zombie
colleges? These universities are living another life online, and no one can say why (msn.com).


