by Michael K. Townsley | May 22, 2022 | Financial Strategy and Operations
U.S. Department of Education (DOE), credit rating agencies, banks, regional accrediting commissions, and boards of trustees want assurance of financial viability from colleges and universities. Different organizations have devised and adopted metrics that they believe are indicators of financial viability. For example, DOE uses a test of financial responsibility; Moody’s Investor Services applies a set of financial ratios; regional accrediting agency reports use audited statements and ratios or indexes recommended by the National Association of College and University Business Officials (NACUBO). The impact of financial metrics is to push colleges and universities to develop strategies and operational plans that produce financial results that conform to the measurements built into the metrics. This push seems to have picked up speed over the last decade as state and federal legislatures worry about the cost of a degree. As a result, they are pushing credit agencies, accrediting commissions, and boards to be more attentive to the financial condition of institutions of higher education.
Why do colleges and universities care about metrics established by third parties? The answer is simple these parties – government agencies, banks, accreditors – control access to resources. The consequences to a college that fails to measure up to third-party metrics could include the loss of authority to issue federal financial aid or a lending agency calling for full payment on loan balances. As a result, the college may be forced to substantially alter its way of doing business. Financial metrics coming from third parties are expanding in scope and rigor; and because of their impact on the existence of an institution of higher education, metrics represent powerful incentives for colleges as they design strategies and operational plans.
Basic Definition and Purpose of a Financial Metric
A financial metric incorporates two components – the metric and the benchmark for the metric. A metric can be generally defined as a measurement standard that sets out the performance level for a particular aspect of the finances of an organization. The metric may be a ratio, a rate of growth, or a particular number[2]. For instance, the metric may be the ratio of net income to total revenue, the rate of growth for total revenue compared to total expenses, or maintenance of an exact amount of money in cash reserves. The benchmark establishes the level of performance for the metric. The benchmark may be defined by government regulations, such as the DOE test of responsibility which specifies passing and failing scores. It may also be defined in terms of standard practice, such as the ratio of net income to total revenue should be greater than two percent or equal to greater than the rate of inflation. Another benchmark could be a metric defined in the covenant section of a debt instrument; for example a covenant may require a college to have cash equal to a portion of bond interest and principle that is available at all times.
The purpose of metric is to signify if performance is better than, less than, or equal to the benchmark, and to indicate if action must be taken to achieve the benchmark or restore the financial condition of the college to the level of the benchmark. Financial metrics exist to compel managers, or in this case college presidents and boards of trustees to take action to assure that they have strategies and plans in place to achieve the designated metrics for their institutions.
Positive and Negative Aspects of Metrics
There are positive and negative aspects to managing by metrics. The positive side is that CFOs and presidents know how external agencies will measure financial performance. The primary advantage of metrics is that they impose financial discipline on presidents, boards of trustees, and chief financial officers. Metrics represent a set of financial performance standards that an institution deems to be relevant to achieving or maintaining its financial condition.
While metrics can have negative consequences as will be noted later, they act as powerful guides as institutions make decision about budgets, capital investments, and fiscal management. When the leadership chooses a set of metrics to measure financial performance, they also accept the implied condition that their financial decisions must conform to the performance levels delineated by the financial metrics of their institution.
For the board of trustees, financial performance when compared to the chosen financial metrics can assure them that current financial strategies and plans are appropriate to strengthening the financial condition of the institution; metrics can indicate that the current financial strategy and plans are not working and a new financial strategy is needed. Using metrics is only useful if they are accompanied by a formal reporting system that compares actual performance to the metrics over time. In other words, the leadership of the institution must see the trend for each metric and if changes in the trend are favorable or unfavorable.
Given that metrics are only as effective as a reporting system that is taken seriously, the following also must occur:
- The president and chief administrative officers must formally meet, review performance, and determine if and where changes need to be made. By extension, they should prepare a brief formal document laying out the financial state of the college and any strategic or operational changes that are needed to achieve the performance level required by the metrics.
- The president must present the metric performance report to the board of trustees so that they can evaluate on their own if the plans are appropriate.
The negative side of metrics is that they can constrain the options available to a college, in particular, financially-weak colleges that are developing a new financial strategy. Metrics can limit a financially-weak college as they move from their current weak financial position to a stronger more viable financial state. During the transition, the metrics may show that the financial viability of the college is continuing to deteriorate before a turnaround strategy takes hold. An example would be a college that has reported deficits for several years because there is no longer a market for its academic programs.
This college needs to reallocate its resources and invest in new programs. As the strategy is implemented, the cost of the investment may be greater than the savings from a reallocation of and a reduction in staff and faculty. During this period, the financial metrics for the college will probably deteriorate, which could depress metrics and present problems with bank covenants, regulatory tests, and accreditors.
The other downside with managing to the metrics is that it could distort the priorities of the college. That is to say that sustaining the metrics may become more important than the mission of the college and the services designed to deliver on the mission.
Sources and Examples of Metrics
There are several sources for metrics and their associated benchmarks. In several cases, the metrics are required either through government regulation, debt covenants, or accreditation commissions. Other metrics may be selected by the institution because they represent industry standards that can measure financial performance. Benchmarks are either defined by regulation, set-out in debt documents, specified by accreditors, or generally available through published documents. The following list of metrics are commonly required or selected by colleges and universities.
- The U.S. Department of Education (DOE) test of financial responsibility [5] uses three ratios to indicate if the financial condition of the college is weak and needs to take action to substantially improve its financial condition. If test scores are below designated levels, regulatory guidelines can require the institution to post a letter of credit; or if test scores remain below levels over a number of years, DOE may no longer grant the institution the authority to award federal financial aid.
- The three ratios are:
- Primary Reserve (similar to CFI)
- Net Worth (net assets / total assets)
- Net Income (unrestricted net income / unrestricted revenue).
- The values for these ratios are adjusted by a set of strengths and weights; and the sum of these values yields the test score.
- Test scores less than 1.5 may result in regulatory sanctions.
- The Composite Financial Index [7] uses four ratios to measure the financial condition of private colleges and universities, as follows:
- Ratios:
- Primary Reserve Ratio measures operational risk with this relationship: expendable net assets to expenses
- Net Income Ratio measures short-term risk with this relationship: net operating income to operating revenue
- Return on Net Assets Ratio measures risk to production of wealth with this relationship: change in net assets to total assets
- Viability Ratio measures long-term debt risk with this relationship: expendable net assets to long-term debt.
- A CFI score less than or equal to three suggests that the financial condition of the college is weak, and it will need to take major steps to improve its financial condition.
- Debt Covenants are metrics in a loan agreement or debt indenture. Here are several examples:
- The condition that the institution not have deficits
- Cash income ratio[8], which relates: net cash from operating activities to total unrestricted income, excluding gains. Median values for this ratio are available in Ratio Analysis in Higher Education[9].
- Basic Financial Metrics are a set of metrics that an institution may employ to measure factors that have a direct impact on the financial condition of the institution. These metrics may include:
- Net tuition ratio – Measures tuition revenue remaining after deducting unfunded institutional aid. The issue is, if this ratio is changing over time, the ratio is: total tuition and fees revenue minus financial aid to total tuition and fees revenue.
- Receivables ratio – Measures proportion of net tuition and fees that are receivables, The issue is, if this ratio is changing over time, higher ratios suggest less cash is being collected; the ratio is: net student receivables to total tuition and fees.
- Bad debt ratio – Measures the proportion of receivables that is bad debt. The issue is, if this ratio is increasing over time, it suggests that the institution is unable to fully convert receivables to cash; the ratio is: uncollectable receivables to student receivables.
- Deferred maintenance ratio[10] – Measure potential burden of deferred maintenance. The issue is, if this ratio is increasing, the institution is incurring an ever increasing burden on its financial assets to restore its buildings and equipment to the proper state; the ratio is: outstanding maintenance requirements to expendable assets (the denominator is the same as the numerator for the Primary Ratio in the CFI).
- Financial assets ratio – Measures the proportion of assets devoted to financial assets. The issue is, if this ratio is declining, then the institution is potentially losing the capacity to support its operations from endowments; the ratio is: net investments and cash to total assets.
- Endowment performance – This metric is the annual rate of return for endowment assets. The issue is the same as with the financial assets ratio.
- Enrollment growth – This metric is the annual rate of growth for enrollment by level and by program. There are multiple issues: is enrollment growing, shrinking, or remaining by level, and by program? Any significant shifts could have financial effects.
- Average class size – This metric measures total average class size and average class size by full- and part-time faculty. This metric is a rough measure of the efficiency of class scheduling and the constraint imposed by room capacity.
- Compensation per student – Since compensation makes up more than sixty per cent of the expenses at most colleges and universities, it is important to know if that burden on students is increasing, decreasing or remaining level. Compensation is a sum of the total salaries, benefits, and taxes, which include social security, Medicare, and other special employment taxes that the institution may have to pay. The following ratios measure the relationship of compensation to students for major functions of the institution:
- Administrative compensation per student
- Faculty compensation per student
- Academic affairs compensation per student
- Student services compensation per student
- Institutional compensation per student.
Summary
Financial metrics should support the analysis of equilibrium and development of plans to achieve a state of equilibrium (see Chapter XIII) and strategies and plans flowing from using the financial paradigm (see Chapter XII) to efficiently use the financial resources of the institution. Financial metrics should be seen as the web which ties together financial strategies and the plans that should strengthen the financial viability of the institution.
|
Take Away Points
- CFOs must do more than manage to net income.
- Financial management should cover critical metrics for assets, liabilities, net assets, cash, net income, and debt covenants.
- Financial strategies and budgets should be tested against the metrics.
- Annual reports should compare performance to metric benchmarks.
- The president, CFO, and chief administrators should immediately formulate turnaround plans for those segments of the college that failing to achieve their metric benchmarks.
- The college administration should have the authority and the responsibility to manage to the metrics.
|
Endnotes
-
1988; Cave, Martin, Stephen Hanney, Maurice Kogan and Gillian Trevet; The Use of Performance Indicators in Higher Education; Jessica Kingsley Publishers, London; pp: 17-18 ↑
-
2004; Financial Aid Professionals: Methodology for Regulatory Test of Financial Responsibility Using Financial Ratios; (September 29, 2004); (Retrieved November 1, 2010) http://www2.ed.gov/finaid/prof/resources/finresp/finalreport/execsummary.html ↑
-
2005; Salluzzo, R.E., Tahey, P., Prager, F.J., & Cowen, C.J.; Ratio analysis in higher Education, 6th edition published by KPMG, LLP & Prager, McCarthy & Sealy, LLC; pp 94-99 ↑
-
2005; Salluzzo, R.E., Tahey, P., Prager, F.J., & Cowen, C.J.; Ratio analysis in higher Education, 6th edition published by KPMG, LLP & Prager, McCarthy & Sealy, LLC; p 109 ↑
-
2005; Salluzzo, R.E., Tahey, P., Prager, F.J., & Cowen, C.J.; Ratio analysis in higher Education, 6th edition published by KPMG, LLP & Prager, McCarthy & Sealy, LLC; p 109; p 124 ↑
-
2005; Salluzzo, R.E., Tahey, P., Prager, F.J., & Cowen, C.J.; Ratio analysis in higher Education, 6th edition published by KPMG, LLP & Prager, McCarthy & Sealy, LLC; p 109; p 81 ↑
by Michael K. Townsley | May 22, 2022 | Enrollment and Marketing
NACUBO Warns – Enrollments May Be Declining with Tuition Discounts
First Published on Stevens Strategy Blog
NACUBO just published its survey of tuition discounting and the results are disturbing. For the first time, a number of private colleges reported that new student enrollment declined despite increases in a tuition-discounting program. Over the past several decades, tuition discounting strategies have provided private colleges with a mechanism to increase tuition by 2% over inflation while deflating the increase for new students through higher tuition discounts.
When tuition discounting strategies stop working, new student revenue drops and net tuition revenues fall below expectations. Failed discounting strategies will quickly undermine the budgetary and financial stability of many private colleges.
There are two possible reasons that may explain why tuition discounting strategies are losing their punch. The first is based on the underlying economics of discounting strategy and the second is possibly due to diminishing returns with tuition discounts. This blog will talk about why the economics may be changing and how the tuition discount algebraic expression could accelerate the problems with lost net tuition revenue.
Economic Premise Underlying Tuition Discounting – Price Inelasticity
The basic economic premise underpinning tuition discounting is that students are price inelastic. This means that if discounts do not reduce tuition below the previous year’s tuition rate, an increase in tuition will not result in a loss of student revenue. More than likely, if the new tuition level leads to a drop in new student enrollment, it will be small and the higher tuition rate will offset the loss.
Why are students’ price inelastic? Students in the past have not been price shoppers. They tend to pick a college based on hearsay or recommendations from friends or family. Also, students have not needed to shop around because tuition could be paid from savings or discretionary income or, if they borrowed money, they did not accumulate large amounts of debt. Also, until recently, students finished their degree at the college where they first enrolled. They did not transfer elsewhere because transferring credits was too difficult and their personal investment in their own academic credits and social network were too high to forego.
When tuition discount strategies were well-behaved (as in Chart I), enrollments grew and total tuition revenue increased. Presidents and Chief-Financial-Officers counted on tuition strategies to produce anticipated patterns of tuition income flow, which led to budgetary and financial stability.
Chart I
Well-Behaved Discounting: Tuition Net of Inflation (0%). Annual Increment (5%) and Discount (base year discount: 42% with annual tuition increment of 1%) Compared to the Net Tuition Rate
Are Students Becoming More Price Elastic?
Recent evidence suggests that students and their parents have become aggressive shoppers looking for the best price. As colleges ease their rules in accepting transfer credit, they are encouraging students to continue to shop for the best deal, be it price, academic programs, sports, or amenities, even when they have already enrolled and earned credit. The best deal may encompass more than price. One of the unexpected outcomes, with the increasing probability of transfers, is that colleges are forced to deal with both new students and keeping their currently enrolled students. Shopping by both new and enrolled students suggests that price inelasticity is waning as students become more price elastic. Greater price elasticity will distort the customary tuition discount strategy of jacking up tuition prices then discounting it to new students. Price elasticity suggests that higher tuition levels will drive students to find cheaper alternatives and that they may prefer easily understood posted prices rather than complex financial aid packages.
The Tuition Discount Formula Contains a Kicker
The tuition discount strategy typically has two components, a rate of change for tuition and a rate of change for tuition discounts. As price inelasticity wanes and is replaced by greater price elasticity, a quirky aspect of the tuition discount strategy rears its ugly head.
When price elastic conditions prevail, tuition discount strategies incorporate a kicker. The kicker becomes apparent because static enrollment no longer masks the tendency of the tuition discount to produce diminishing returns and negative dollar changes. This perverse aspect of tuition discounting is readily evident in Chart II.
Chart II
Hidden Kicker: Tuition Net of Inflation (3%), Annual Increment (5%) and Discount (base year discount: 42% with annual tuition increment of 1%) Compared to the Net Tuition Rate
Under the inflationary, incremental tuition, tuition discount, and static enrollment conditions in Chart II, posted tuition has a nice positive slope. However, net tuition rate exhibits an alarming negative slope. As price elasticity takes hold, more colleges will find that as the enrollment mask is stripped away, net tuition rate will generate diminishing returns. By implication, diminishing returns for the net tuition rate will carry through to diminishing returns for net tuition revenue. Chart III clearly illustrates how marginal changes (diminishing returns) have a very steep and negative slope. Presidents and Chief Financial Officers need to be worried about diminishing returns when tuition discounting strategies stop working; i.e., enrollment no longer increases as net tuition rates increase over time.
Chart III
Effect of the Hidden Kicker on Marginal Change in Net Tuition
Private Colleges Should Take Prudent Steps to Build New Financial Strategies
For years, private colleges have been able to have their cake and eat it too by raising tuition faster than inflation and then partially reducing the impact through tuition discounts. If tuition discount strategies are losing their capacity to generate new net tuition revenue, then it is prudent that private colleges, especially financially weak institutions, consider alternatives to the classic tuition discount strategy. Moreover, government and media criticism about rising posted tuition charges only adds pressure to colleges to find new ways to fund the delivery system for education without depending upon never ending increases in tuition rates.
What Should Colleges Do If the Tuition Discount Strategy Is Becoming Obsolete?
Private colleges will need a different perspective if they intend to develop new funding strategies and to deal with governmental oversight on tuition prices. Here are several strategies for managing tuition pricing that Stevens Strategy has implemented with our clients.
- Responsibility Centered Management (RCM) Analysis: this service identifies programs that generate sufficient net income to support the general operation of the institution. This analysis can be the basis for developing expense allocation strategies, cost controls, and new income producing programs.
- Programs and Resource Optimization (PRO): adds mission centeredness and quality and marketability reviews to the RCM analysis.
- Operational Cost Analysis: this service pinpoints cost efficiencies and inefficiencies.
- Financial, Marketing, and Operational Reviews: Stevens Strategy works closely with the President and Chief Operations Officers to review current financial, marketing, and income production strategies, practices, policies, and operational systems to determine if they support the mission of the institution, generate adequate income, and provide a smooth-running cost-effective operation.
- Financial Health Checkup: this service involves a thorough evaluation of financial conditions both short- and long-term to determine if financial stability is improving or declining.
- Equilibrium Analysis: this service focuses on the strategies needed to achieve economic equilibrium given known economic, financial, regulatory, competitive, and operational conditions.
Stevens Strategy recommends that Presidents and Chief Operational Officers conduct a careful review of their institutional discounting strategies, plans, and performance data. Our firm can assist you in conducting the review and provide recommendations on changes that may need to be made to manage and control tuition and discounting strategies.
by Michael K. Townsley | May 22, 2022 | Strategic Planning
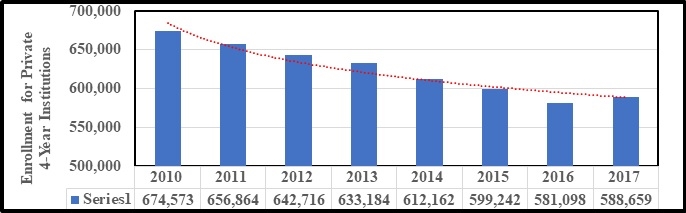
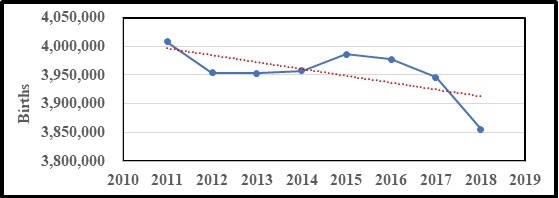
Debra Townsley, author of articles on strategy and presidential leadership and Michael Townsley have a new book – Colleges in Crisis. The central theme of this book is that the massive decline forecast for prospective college students over the next decade will push many private colleges to and over the brink of survival. The book looks to answer this question ‘What strategies can Presidents and Boards of Trustees apply to confront this crisis?’
The book covers: the decline in enrollment due to a collapse of the birth rate that is amplified by high cost of loans and the decline in liberal arts enrollment; inherent conflict within institution governance structure that delays strategic changes, and ways institutional leaders can move forward with strategic changes.
Section 1: Enrollment – Shrinking Demand
-
- Current state of enrollment for Private 4-Year Institutions 2010 to 2017
- Birth Rates from 2010 to 2019
- Investment in Education Hindered by Future Cost of Debt
Anna Maria Andriotis, Ken Brown and Shane Shifflett in a 2019 article in the Wall Street Journal reported that:
“The American middle class is falling deeper into debt to maintain a middle-class lifestyle. Cars, college, houses and medical care have become steadily more costly, but incomes have been largely stagnant for two decades,. [1]
-
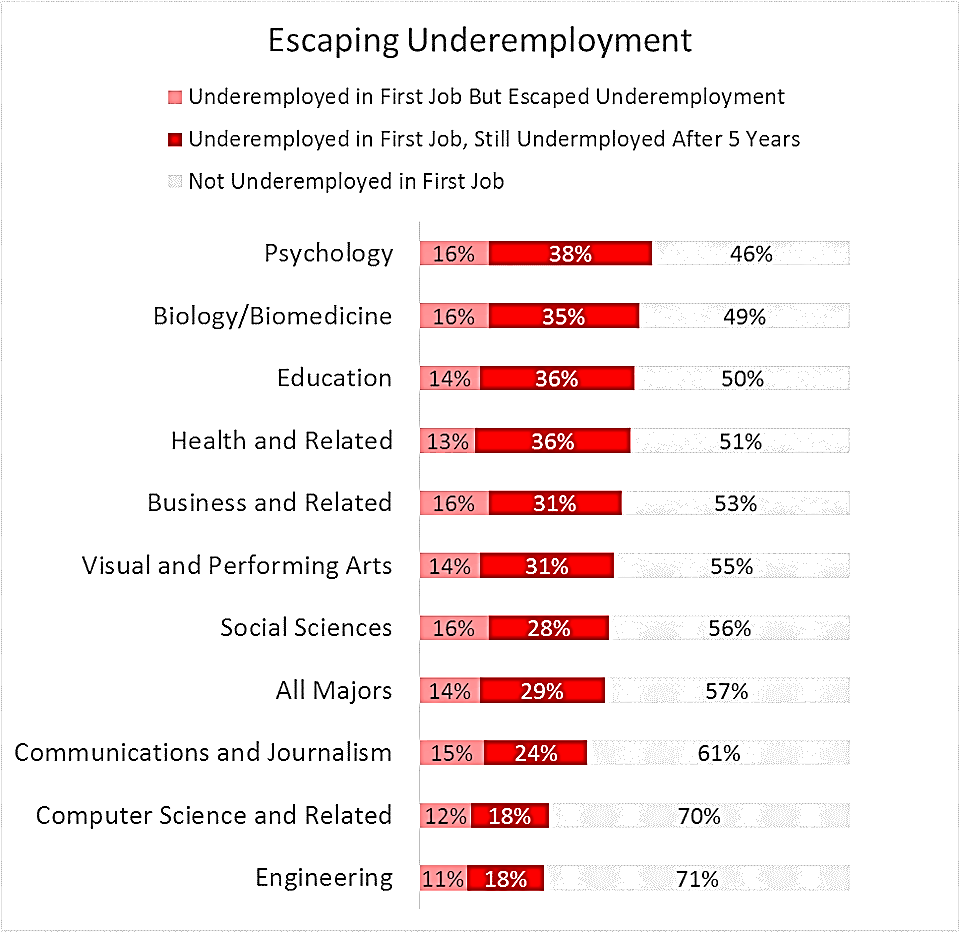
- Shifting Preference for Academic Majors[2]
-
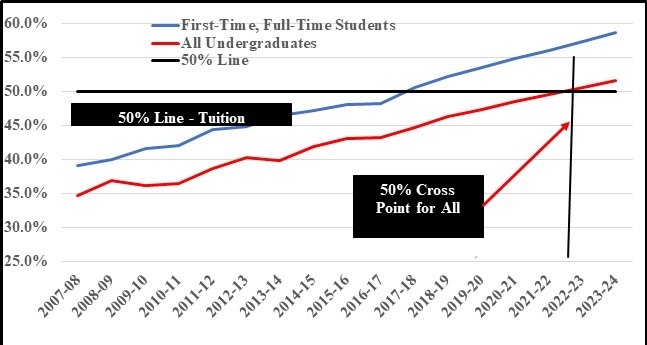
- Price Competition – Tuition Discounting [3]
Section 2: Private Colleges are Sliding into Financial Distress
-
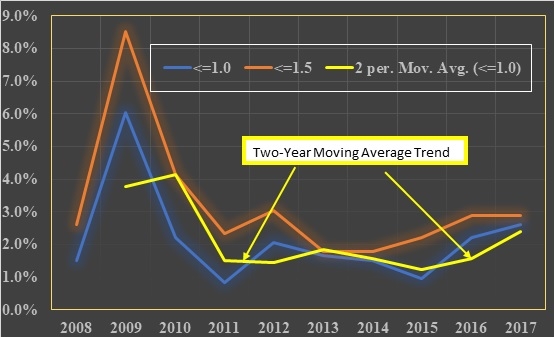
- Percentage of Not-For-Profit Colleges Reporting Financial Distress Under the Department of Education’s ‘Test of Financial Responsibility’” for the Period: 2008 to 2017[4]
-
- Institutional Averages: Full-Time Equivalent Students, First-Time, Full-Time Equivalent Students, and Total Expenses: Period 2010 to 2017[5]
|
2010 |
2011 |
2012 |
2013 |
2014 |
2015 |
2016 |
2017 |
Compound Rate |
| Total N of Institutions |
242 |
|
|
|
|
|
|
| FTE |
1,615 |
1,614 |
1,607 |
1,596 |
1,584 |
1,572 |
1,563 |
1,549 |
-0.59% |
| FT-FTE |
414 |
410 |
406 |
407 |
405 |
403 |
405 |
401 |
-0.45% |
| EXP (000) |
$62,620 |
$64,267 |
$66,713 |
$68,531 |
$70,258 |
$72,109 |
$74,174 |
$75,363 |
2.68% |
Section 3: Causes of Resistance to Strategic Change
-
- Contradictions of dual authority governance systems
- Faculty tenure
- Political model of decision-making through interest group subverts hierarchical decision-making
- Constraints imposed by accreditors and regulators
- Legal constraints – explicit and implied
- Mismatch between human and tangible capital investment and the student market
Section 4: Strategic Options to the Coming Demographic Crash
- Leadership Rubric of Change
- Comprehensive Strategic Phased Planning
- Partnership and Merger Options
Target for Publication: January 2020
- Endnotes:
Androitis, Ann Marie, Ken Brown, and Shane Shifflet (August 1, 2019); “Families Go Deep in Debt to Stay in the Middle Class”; Wall Street Journal; https://www.wsj.com/articles/families-go-deep-in-debt-to-stay-in-the-middle-class-11564673734. ↑
- Cooper, Preston (June 8, 2018/); Underemployment Persists Throughout College Graduates’ Career”; Forbes Magazine; https://www.forbes.com/sites/prestoncooper2/2018/06/08/underemployment-persists-throughout-college-graduates-careers/#547d9a087490. ↑
- “Private Colleges Now Use Nearly Half of Tuition Revenue for Scholarships (May 9. 2019); NACUBO. ↑
- “Federal Student Aid (Retrieved October 16 ,2019); “Financial Responsibility Scores”; Office of the U.S. Department of Education; https://studentaid.ed.gov/sa/about/data-center/school/composite-scores. ↑
- John Minter & Associates (August 8, 2019); Data Extracted for a select set of colleges from the 2017 Data Set – Integrated Postsecondary Education System. ↑
by Michael K. Townsley | May 22, 2022 | Presidential Leadership
First Published on Stevens Strategy Blog
Presidents and chief administrative officers need to develop a fine hand at delegating authority. The blog on Scarce Resources speaks to the limited amount of time and energy that the top level administrators have. If the president tries to do everything for everyone else then nothing will be done well because mistakes will be made as strategic initiatives and projects are rushed or put aside and forgotten because there is not enough time. The same problem exists for chief administrators who do not develop the skill to delegate authority.
For some reason, many higher education leaders are reluctant to delegate authority. If and when they do delegate work, they might give imprecise instructions because they give them verbally. Too often the delegation takes place in a passing conversation. The leader making the delegation assumes that the delegation is understood even though the person receiving the delegation may or may not have understood what was said but is reluctant to ask for clarification. The result is a botched delegation and what was done or not done does not meet the expectations of the leader. Eventually, leaders just dive in and do it themselves, and they have fallen into the trap of expending their scarce time and energy resources on something that could have been done by someone else.
Before we lay out the rules of delegation, we need to define what delegation means. Project delegation occurs when someone is given authority and responsibility to complete a specific project or task within a specified time period. With this type of delegation, when the project is completed, the assigned leader’s position comes to an end. Examples of project management would be the development of student flow procedures from admissions, registration, academic services, to graduation. The reason for this blog is to provide presidents and chief administrative officers with a template for managing the process of delegation for a short-term project.
This blog will lay-out basic rules of delegation for short-term projects. Effective delegations of authority should have a Statement of Delegation that lays out authority, control, communications, participants, and funds available for managing the project. The rules for delegating project management are described below.
- Major sections of the Statement of Delegation:
- Description of the project
- Objective of the project
- Project Leaders authority and responsibility
- Report and Management assignment of a Chief Administrative Officer
- Handoff of the project to operational managers, if appropriate
- Project Leaders name
- Colleagues assigned to the project work team
- Time line
- Budget
- Reports
- Project Description Section: a brief two or three sentence description of the project and its purpose
- Project Objective: what the team is to accomplish and by when
- Project Leaders Authority: the authority that the Project Leader is assigned to accomplish, coordinate, control, and resolve conflicts
- Report and Management: assign a Chief Administrative Officer (or the President if the Project Leader is a Chief Administrative Officer) to supervise, review, and resolve obstacles or problems that delay completion of the project
- Handoff: how and when the project becomes operation
- Project Leaders Name and Colleagues – names, email addresses, and phone numbers
- Time Line: specifies when the project starts, when reports are due, and a date for completing the project
- Budget: refers to funds assigned to complete the project
- Reports: list the type of reports needed to show progress and to whom the reports are sent
Delegation is only effective when the chief administrative officer (or the President) who supervises the Project Leader meets regularly with the Leader to review progress, problems and cost. If these supervisory meetings do not take place, there is a good chance that the project may fail to accomplish its objective or meet its deadlines. Delegation is an interactive process that calls for a continuous flow of information between supervisor, project leader, and colleagues participating in the project.
by Michael K. Townsley | May 22, 2022 | Presidential Leadership
First Published on Stevens Strategy Blog
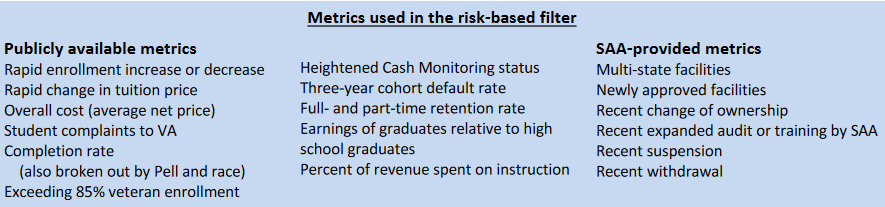
The February 2, 2022 issue of Inside Higher Education carried the article “Using College Outcomes to Gauge Risk for Students” by Doug Lederman. [1] The article addressed how to protect veterans from choosing a college that might not survive. The article reviews several measures to identify the potential signs that a college might fail. This blog will comment on assumptions of the underlying measures of college survival and the validity and construct of those measures. The article includes these “metrics used in the risk-based filter.”
The article does point out a fundamental political question raised by Rebecca S. Natow, Assistant Professor of Educational Leadership and Policy at Hofstra University:
“She said via email that an accountability regimen that applied to all colleges and universities …would struggle to gain the sort of bipartisan support that measures about veterans do.
The two main political parties have been much less likely to agree on accountability policies affecting Title IV programs more broadly, such as the gainful-employment rule, Natow said. It could be brought about through executive action, as much federal policy making in higher education has been [recently], but that typically results in legal challenges and flip-flopping as a new administration takes office.
Leaving matters in the states’ hands, in contrast, typically results in vastly uneven regulation, with some states being rigorous and others less so, Natow said.”
Moreover, another broad assumption is that government bureaucrats would enforce regulations to constrain risk. Instead, bureaucrats might determine that the greater risk is to themselves because enforcement could see the demise of institutions that are supported by powerful interest groups and by formidable political leaders. One example of this phenomenon of non-enforcement of risk regulations is that year after year the same colleges fail the Department of Education (DOE) ‘Financial Responsibility Test,’ yet the DOE rarely takes action.
General Comments: This section covers several significant sources of inefficiency.
- Managing risk in higher education assumes that colleges are attuned to factors that increase risk and that they have the power to control them.
- An important problem with nearly every metric and model of risk is that they are not rigorously tested to evaluate if they are valid. Too often the models are victims of post hoc analysis because they don’t take into account colleges that have closed.
- Of course, the main question regarding risk is how to define risk in higher education. Richard Cyert provides a way into understanding that risk. According to Cyert, a college needs to reach a state of economic equilibrium to assure its long-term survival. According to his model, financial equilibrium occurs when there are sufficient resources to sustain an institution’s mission for current and future students.[2] Therefore, risk would be the probability that the financial resources of an institution could or could not sustain the academic program (assuming that academic programs are the primary mission of the institution) for current or future students.
Comments about Risk Metrics and Models:
- Risk metrics are burdened by the inherent problems associated with the excessive aggregation of institutional data that limits the capacity to clearly identify issues below the broadest institutional levels. In other words, because refined data is not available, models and metrics too often assume that available and overly aggregated data will be valid predictors of risk.
- Over the past several decades, financial risk has been measured by importing business ratios. The assumption is that business ratios can capture the financial condition of an institution of higher education. However, business rates are designed to measure risk in terms of the capacity of the enterprise to generate sufficient cash flow to sustain on-going operations. Colleges, on the other hand, can and often survive for decades on the cusp of financial disaster as measured by business ratios because annual gifts, new government funds, or donors who make large gifts repeatedly pull an institution’s chestnuts out of the fire.
- Even though some colleges have survived for years as mere husks of an institution of higher education, these institutions often fail to achieve Cyert’s equilibrium condition that colleges need sufficient resources to support their mission and to serve their students for the short- and long-term. When colleges are merely husks, they too often may produce a degree with little or no value to graduating students.
- Certain risk-filter models hypothesize that they can forecast grave risks using seven or more years of long-term data for predictor variables. The problem with these models is it they assume that the predictor variable is continuously downward sloping. While these models may identify some institutions at risk, they often miss many institutions where early data may be positive, and then due to external or internal conditions, the predictor data suddenly turns negative. Regrettably, the adverse effect of a short-term and hazardous decline in a predictor variable may be dampened by earlier positive performance using long-term data. The best way of testing a risk-filter model is to test it against a data set that includes institutions that have already failed. Sadly, this data is often hard to locate because when institutions close, they are no longer identified in data sets.
Risk Based Filter Metrics Included in “Using College Outcomes to Gauge Risk for Students”
The following table is from the Inside Higher Education article, which includes risk metrics that were being considered by the Veterans Affairs Administration to protect veterans from enrolling in a failing college. These metrics are also commonly found in other risk models. After the table, there are several comments about the Veteran Affairs metrics suggesting which metrics are the most and least valuable.
The following risk-based factors are of modest or no value in determining short-term risk:
- Rapid enrollment increases or decreases: This metric is used in risk models and financial reviews, because for most private colleges and universities enrollments are the main drivers of revenue. If the period to measure the change in enrollment is too long, the change within the period may mask real problems in a shorter time frame. Change in enrollment is a worthwhile metric only when compared to changes in direct expenses (instruction, student services, and academic support).
- Rapid change in tuition price: this measure is an insufficient measure of risk because it does not get at the price paid by a student. The metric Overall Cost does measure the cost to a student.
- Completion rate (by Pell and race): This is a pertinent measure for government agencies to determine if their investment in a college is producing value for veterans. Moreover, prospective students may choose not to enroll at an institution with high attrition and low graduate rates. This measure is not a valuable risk metric of short terms risk because it requires data collected over a long period of time.
- Exceeding 85% VA enrollment: This metric is a VA regulatory measure to limit funding to an institution that mainly focuses on veterans, but it does not measure risk of institutional failure.
- Three-year cohort default rate: The presumed default rate is on federal loans. The underlying assumption is whether prospective students will continue to enroll if they graduate with loan balances that cannot be paid from their income. This metric might be useful in the long-term assuming that prospective students take earning after graduation into account when they agree to loans. However, the effect of the three-year cohort metric may become evident only after the college or university is already about to close due to other factors.
- Earnings of students relative to high school graduates: This metric is both an institutional and an academic program issue. The question is: “What is the point of enrolling in a program if a degree has no more (or even less) value than a high school diploma?” This issue is also germane to institutional marketing efforts. Assuming that future earnings from an institution or a program are known to prospective students, many will reject the choice if future earnings are insufficient to cover future expenses, as was noted in the default rate comment. This metric would be useful in analyzing programs in a long-term analysis, but it may have little practical value as a measure of short-term institutional risk unless all or most of the institution’s programs have little relative economic return in comparison.
- Percent of revenue spent on instruction: The assumption here is that as the percentage of money for instruction decreases, the quality of instruction also decreases. However, innovations in instructional delivery can reduce costs and increase quality. Instructional expenses can decrease at colleges that allocate more funds for student services and academic support to improve retention and graduation rates. ‘Percent of revenue spent on instruction’ as a risk metric is too limited.
- Note that the SAA metrics are mainly of interest to accreditors or government agencies and are not discussed here.
The following risk-based factors are of effective value in determining short-term risk:
- Overall Cost (average net price): This metric represents the out-of-pocket costs that veterans are being charged. If the metrics in the table are intended to measure risk, then this metric can illuminate the cash flowing from enrollment to cover direct costs. Multi-year evidence shows that while tuition net of institutional grants has fallen (in other words, students are paying less out of pocket), direct costs have been increasing. This means that the risk to the institution is increasing as net tuition declines and direct costs go up.
- Student complaints to VA: This is a good way for the VA to identify problems because the complaints are coming directly from students enrolled in a college or university.
- Heightened cash monitoring status: This metric gets at the central issue of whether an institution can survive. If a college or university does not have sufficient cash reserves to cover on-going operations and debt-service, then they may have to turn to lenders for short-term loans. If short-term loans increase in size over time, then the institution is at risk when unexpected events like the Covid pandemic occurs.
- Full and part-time retention rates: As retention rates fall, the need to find new students to bolster enrollment, along with associated marketing costs, increases. In addition, there is a possibility that falling retention rates imply that the academic programs are not designed to reach the academic skills of the students enrolled by the college. This metric also ties into the discussion about ‘Completion Rates’.
Several Other Metrics That Measure Risk Effectively:
Here are several risk metrics that could be used independently or assembled into a model:
- Net Student Revenue: If the sum of tuition net of institutional grants plus auxiliary income (excluding hospitals) and net of expenses is increasing, Net Student Revenue yields more funds for operations, while shrinking Net Student Revenue reduces capacity to support operations, which places the institution at risk.
- Net Student Revenue to Direct Expenses (instruction, student services, and academic support) Ratio: An increasing Net Student to Direct Expense Ratio is able to support a greater proportion of direct expenses or even produce excess revenue to cover indirect costs (ex. institutional support, plant, debt, etc.). A decreasing ratio reduces the proportion of funds available for direct funds and puts pressure on the college to find other sources of revenue, which is often not possible for tuition dependent colleges, thus placing the institution at risk.
- Class Size Ratio (the average number of students in front of an instructor): The larger the class size the greater the net direct instructional revenue and the smaller the class size the lower the net direct instructional revenue, increasing institutional risk.
- Class size in classes required by a major: Very small class sizes indicate that the major is not supporting the operational costs associated with the major. The greater the number of these underutilized majors, the greater the institutional risk.
- Net Tuition Revenue plus grants to Operational Costs of a Major Ratio: A small or declining ratio suggests that the major is unable to support itself. The more the number of these majors, the greater the institutional risk.
- Space Usage Ratio: This ratio measures the percentage of building space used during a fully employed period of sixteen hours. A low usage ratio suggests that building space is not fully optimized to cover debt service, operational costs, or repair and maintenance, and is an indicator of future risk.
- Cash Flow Metrics: As indicated in the preceding section under the heading “Heightened cash monitoring status,” cash is a common metric in measuring risk. Here are several ways to measure if the college is building or depleting its cash reserves:
- Cash Flow from Operations: This metric is found in audit reports and shows cash is the main reserve from which operations are supported.
- Cash from Operations to Net Change in Assets from Current Operations: This measures whether operations are increasing or depleting cash.
- Total Cash: This shows if the college is building its cash reserves from all sources of cash. It also measures if trends in total cash are increasing or decreasing.
- Negative cash trends are a definite indicator of future risk.
Risk Management – Preserving the Mission
If risk is defined by Cyert’s proposition that colleges risk their capacity to deliver on their mission if they do not have sufficient financial reserves, then the question arises: “How does an institution reduce its risk?” Colleges and universities can reduce risk by determining whether or not their mission is achievable given the resources that they have available. This proposition suggests that the following questions need to be addressed:
- What is the mission of the college?
- Does the mission fit the demands (expectations of students)?
- Does the mission need to be reconstrued to respond to the student market?
- If the mission needs to be rewritten, will the corporate by-laws support the change in the mission or do the by-laws need to be modified?
- Do academic programs need to be revised to respond to the expectations of students?
- Should resources, both fiscal assets and personnel, be reallocated in response to changes in the mission and academic programs?
- Ought the administrative footprint and physical assets be restructured or eliminated to release resources toward instruction and instructional support?
- What is the enrollment and net tuition price point needed to generate the funds needed to operate new academic programs and build financial reserves?
- How should marketing strategy and actions be redesigned to support changes in the mission, enrolled students, and academic programs?
There are many more questions that may need to be answered to perfect models of risk. Nevertheless, the economic environment reshaping higher education today makes it necessary to address these questions sooner rather than later.
ENDNOTES
-
Doug Lederman; (February 2, 2022) “Using College Outcomes to Gauge Risk for Students”; Inside Higher Education; A possible model for identifying riskiest colleges for students (insidehighered.com). ↑
-
Townsley, Michael (2014) Financial Strategy for Higher Education: A Field Guide for Presidents, CFOs, and Boards of Trustees; Lulu Press; Indianapolis, Indiana; p. 15. ↑