by Michael K. Townsley | Mar 17, 2026 | Financial Strategy and Operations
Here are several considerations when making large changes to budgets and financial strategies.
- Have you run a realistic three-year forecast that includes a careful test of the effect of demographic changes on your enrollment flow?
- Before adding new and large expenditures –
- What is the short- and long-term impact of the expenditures on the bottom line?
- Are there additional resources needed to support the increased expenditures?
- How many new students are needed to offset the new expenditures?
- How long will it take to cover the cost of the new expenditures with new students?
- When adding a new revenue program –
- How long will it take to reach breakeven on the program?
- What assurance are do you have that students will come?
- What is the cost of the marketing program?
- Have new or renovated facilities been included in the budget?
- Does the budget for the new program include utilities, maintenance costs, and custodial costs?
- Does the college have a deferred maintenance list –
- Does the list identify buildings and infrastructure with the greatest risk of failure in the short-term?
- What is the cost of these short-term risks and what happens if they fail?
- How would the college provide the funds to fix a critical failure?
- What is happening with debt –
- How much debt is the college carrying?
- Are debt payments depleting cash at a fast rate?
- Is long- and short-term debt increasing faster than the college can support?
- What percentage of the campus is collateralized?
- Is the college in danger of violating debt covenants?
- Has the Chief Financial Officer and President talked to lenders about the possibility of renegotiating terms or consolidating loans?
- Richard Cyert Economic Equilibrium Model – if the college has produced a series of deficits, it needs ever larger short-term loans to provide sufficient cash, and the demographic bust is expected to produce economic disequilibrium. The Cyert Equilibrium Model can be used to estimate the amount of income and reduction in expenses to reach equilibrium. There model has two parts – the first part identifies the ‘current disequilibrium sources,’ and the second issued to estimate what
Cyert Model – Part 1
Current Fiscal Year Cyert Disequilibrium Gap Measure
|
Gap Category
|
Gap
|
|
Operational Deficit
|
|
|
Credit Line (total amount borrowed)
|
|
|
Accumulated Deferred Maintenance Infrastructure
|
|
|
Accumulated Deferred Maintenance Buildings
|
|
|
Accumulated Deferred Maintenance IT
|
|
|
Total Disequilibrium Gap
|
|
Cyert Model – Part 2
Cyert Equilbirium Estimate
| |
FORECAST
|
|
Equilibrium Grid – Operations & Current Net Assets
|
Total Current Net Assets
|
Year 1
|
Year 2
|
Year 3
|
|
Current and Forecast Operational Net
|
|
|
|
|
|
Forecast of Cash for Current and Next Three Fiscal Years
|
|
|
|
|
|
Highest Risk – Deferred Maintenance
|
|
|
|
|
|
Disequilibrium Signal = 1, if Net and Cash is less than the prior year and = 1, if risk is higher than the prior year.
|
|
|
|
|
|
Equilibrium Grid – Total Enrollment
|
Current Enrollment
|
Year 1
|
Year 2
|
Year 3
|
|
Current & Forecast Enrollment
|
|
|
|
|
|
Disequilibrium Signal =1, if it is less than the prior year.
|
|
|
|
|
|
Total Disequilibrium Score
|
|
|
|
|
Note On Equilibrium Grid Score:
- If the disequilibrium score for each year is greater than 0, then the college is in equilibrium.
- If the disequilibrium score is greater than zero for multiple years for any category of current assets or enrollment, this identifies the source of current or future disequilibrium.
- If the total disequilibrium score is rising in the last two forecast years, then the college should take steps to stem the disequilibrium within two years.
- If the total disequilibrium score is increasing and beginning to yield total scores of five, then is speeding toward large scale financial distress and must immediately looks at every feasible means to increase revenue and deeply cut expenses including debt service.
by Michael K. Townsley | Mar 8, 2026 | Private Colleges & Universities in Crisis
The Slender Thread Blogs 1to 4 and articles from Higher Ed Dive, Inside Higher Ed, and The Chronicle of Higher Education make it clear that demographic cliff, when the high school applicant pool massively shrinks is looming ahead in the year. Nevertheless, Inside Higher Ed recently reported that 87% of college presidents believe that their college will smoothly ride through the whitewater rapids from the demographic cliff. Given the tightened fiscal conditions among since COVID, it would seem that the prudent course would be to prepare strategies to reduce the financial effect of the demographic cliff so that the college is not caught unawares.
So why do so many college presidents take a laissez-faire attitude to these existential threats? This issue strikes at the heart of leadership in higher education. The question boils down to a classic conundrum regarding presidents in higher education – are they merely ‘ambiguity game players’, who wait for a line-up of internal forces to confront a problem, or should they be dynamic manager-leaders, who confront threats to their institution.
President – As an Ambiguity Game Player?
What is an ‘ambiguity game player’? Michael Cohen and James March used the term to describe leadership in a university, where dual governance, multiple stakeholders, and ambiguous policies and missions muddle decision-making for the president. An ‘ambiguity game player’ as leader is passive. While they recognize that an existential crisis is on the event horizon, they do not press the organization to quickly take steps to keep the college from slipping into deep financial stress.
When ambiguous leadership conditions exist, and in most colleges, they represent common governance entanglements, presidents believe that they have little choice but to wait until the interests of the major players in the governance structure line up so that a decision might be possible. However, an alignment of interests and the decision that follows does not mean that the decision takes into account the mission, resources, and strategic needs of the college. The process of waiting and working with conflicting interests to produce a decision, reduces a president from a leader to a passive game-player who tries to maneuver around a game board with multiple opponents whose interests rarely align among themselves or with the interests of the college. In other words, the president becomes an ‘ambiguity game player.’
Involvement of the board introduces another layer to the game and if the president passive is vis a vis the board, then it a strong strategic and operational response will depend on the willingness of the board to accept heated opposition. Regrettably, many boards under the ambiguous game scenario are also passive and also prefer to avoid conflict, which leaves the college survival subject to the weak internal actions and luck that the forecasted threats will not be as intense as claimed.
Unfortunately, the current long-term forecast regarding the demographic cliff, massive technological changes, and changes in degree expectations, renders a president, who is an ‘ambiguity game player style’ an ineffective instrument of decision-making. These presidents will find that events will overwhelm the decision time horizon and push a credible response until long after a college is crushed by these existential forces.
President as Manager-Leader
In times of crisis, before a crisis appears a management-leader constantly scans the horizon for threats and opportunities to successfully. They are not passive leaders waiting for internal forces to congeal around a decision but press a solution throughout the organization. Active and expeditious management requires continuous information on external threats to operations and financial stability. Under the management-leadership concept, a management team is assigned to respond strategically and operationally. The president can either be on the team or have the team present their proposals to the president who involves all members in a critical analysis of the proposal, obstacles, and potential for success or failure. The president keeps the board fully informed because any large scale strategic or operational changes will require their sanction before the action can be taken.
Active and expeditious management does not mean being reckless. It means taking a disciplined and rational approach to threats and strategy by scanning the horizon for threats, analyzing the impact of the threat to the college, identifying operational strengths and weaknesses, formulating strategic and operational responses, testing the responses, setting-up an operational plan to put the responses in action, continuously monitoring performance, determining where revisions are needed, and regularly reporting performance, obstacles, and successes or failures to the president.
The President as Manager-Leader is not a natural phenomenon. It requires deep training in all aspects of academic and operational centers and thoughtful and rigorous review by monitors and colleagues. Furthermore, the aspirant president must continuously test their skills by identifying institutional problems and designing strategic and operational response. Then the aspirant should ask either their president or another president to critique their work. The development of a good manager-leader does not happen in months nor in a year; it can take years along with ever increasing operational responsibility.
Can a College Survive with an ‘Ambiguity Game Playing President’?
The sad story for a college with an Ambiguity Game Playing President is that this person has been educated, socialized, and rewarded to avoid risk, lead from the rear, and hope fate is good to the school. Here is a partial solution to this problem, but it depends on the willingness of the board of trustees to press hard for strategic change.
- If the president is reluctant to lead, then the board must determine if that is the person that they want as president.
- If the board or several key board members see rising deficits as a threat to a college’s financial stability, the board should contract with a financial analyst to review the current and five-year forecast of financial performance. The forecast should use the best available estimates for enrollment, expenses, and other threats that may be on the horizon.
by Michael K. Townsley | Mar 8, 2026 | Private Colleges & Universities in Crisis
The Slender Thread blogs look at the capacity of current financial resources to survive the oncoming demographic crash. This blog, Slender Thread – 2, looks at the relationship between changes in tuition and these charts also look at the impact of tuition discounts on enrollment. Economics would suggest that a tuition discount is a price discount that brings demand in alignment with supply. In the case of higher education, demand is enrollment and supply encompasses the courses or programs offered by a college.
Chart 1 uses a simple formula, (change in FTE /change in tuition discounts) to ascertain the relative effectiveness of tuition discounts on enrollment. The chart shows that small colleges, FTE < 1,000), did not having any success using tuition discounts to increase or to even stabilize enrollment in 2024. The relationship between tuition and discounts at large colleges, FTE >= 1,000 fluctuate from year to year. Large colleges reported a steady decline in the effectiveness of tuition discounts between 2019 and 2021 with rising effectiveness in 2022, but effectiveness slid between 2022 and 2024.
Chart 1
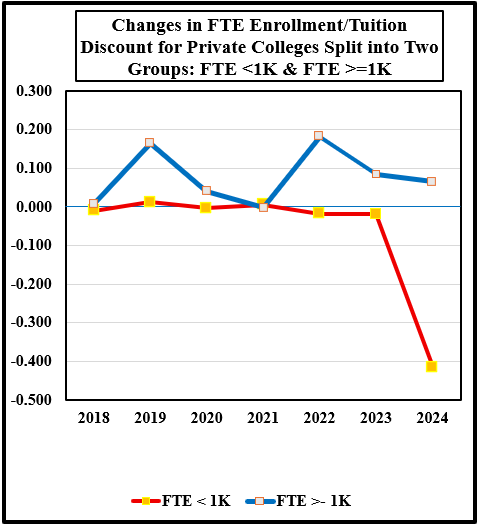
- The data set includes 44 private colleges from IPEDS for the period 2017 to 2024 that offered a four-year degree subject to these exclusions because they have different business models: seminaries, yeshivas, art and music schools, research colleges, and colleges with missing data. The last year for the data is 2024; This set of colleges was split into two enrollment groups: FTE < 1,000 students and FTE >= 1,000 students. The data was then averaged for the two groups for each variable by year. The first chart has the basic data trend for both sets of private colleges, and the next two charts show the linear and a second-degree polynomial trend, i.e., a quadratic equation. ↑
The data and linear trends for small colleges in Charts 1 and 2 suggests that tuition discounts are counter-productive in that enrollment is not increasing relative to tuition discounts. In the case of large colleges, the linear trend indicates that tuition discounts are marginally useful in generating positive changes in enrollment.
Chart 2
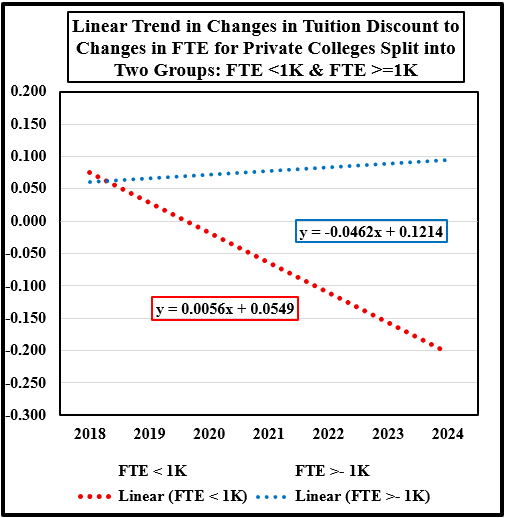
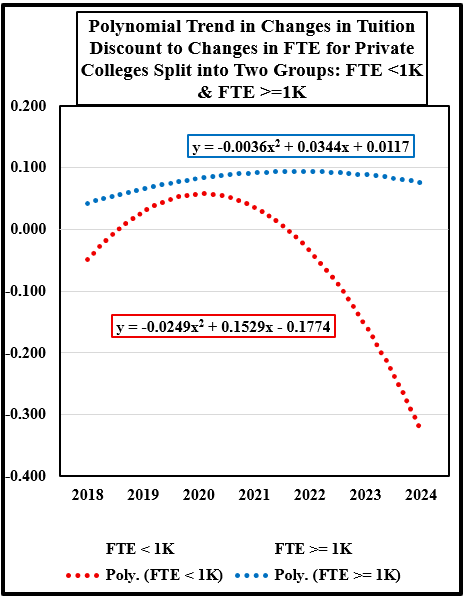
Chart 3 reinforces the comments in Charts 1 and 2, which suggest that tuition discounts are not effective for small colleges. It would be prudent for small colleges to determine whether tuition discounts are providing value to their enrollment strategies. During the demographic crash, many small colleges will find that continuing to increase tuition discounts will reach a point where the flow of cash from tuition for operations expenses be negligible or zero.
The last chart, also, indicates that some large colleges should assess their validity of their tuition discount strategy because their polynomial trend is starting to turn negative. If that curve continues downward as the impact of the demographic crash approaches, then large colleges will find themselves in the same position as small colleges because their operational cash flows could dramatically shrink.
Both small and large private colleges face some very tough decisions in the near future about the continued use of tuition discounts because discounts have become a presumably reliable strategy to increase revenue without disturbing the flow of cash to reserves. However, this assumption may have lost its usefulness.
Chart 3
 Editorial Assistance by Jack Corby, Vice-President of Stevens Strategy
by Michael K. Townsley | Mar 8, 2026 | Private Colleges & Universities in Crisis
Presidential Perception of the Well-Being of Their College
Inside Higher Ed[1] reported that 87% of college president “expressed strong financial confidence” that their institution would be financially stable over the next five years with 83% saying the same over the next ten years. On the other hand, 19% were in serious discussions about a merger, and 9% expected to merge within five years. So, are more than 80% of college presidents deluding themselves, or do they have unique insight that the coming demographic, technological, and confidence in higher education crisis will be easily overcome through deft management.
The preceding four ‘Slender Thread’ blogs suggest that many of the college presidents in the survey may be a little too sanguine. Specifically, I am not sure that their confidence is warranted given the scale of the demographic cliff, the technological smashing of the traditional method of delivering higher education, the growing belief that a degree costs too much, the steady drumbeat from employers claiming that graduates lack basic skills, and the insistence by new students that a college degree must immediately lead to a well-paid career.
The following data tables show what is happening to private colleges as the dramatic changes in higher education begin to gain momentum. These tables suggest that it would be prudent for private college presidents that they need to take into account that their college may not experience a soft landing. Five years and especially after ten years as a massive onslaught slam into their shield of confidence that the future holds little threat to their colleges. Maybe the 19% beginning merger discussions have a more realistic appraisal about the powerful forces threatening the viability of their institutions.
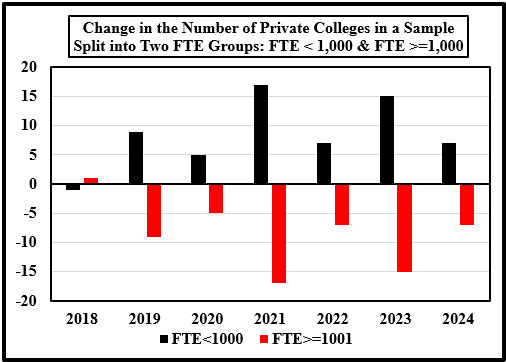
Data on the Count of Private Colleges from 2017 to 2024
Tables 1 and 2 along with Chart 1show what happened to private colleges that are grouped into two sets: FTE<1,000 and FTE>=1,000 between the period 2017-2024. As enrollment changed between 2017 and 2024, an interesting change took place, when fifty-nine large colleges dropped into the category of small colleges. As the preceding four Slender Thread blogs pointed out, small colleges face greater risks of financial distress. The problem facing these size category changers is whether the fall in enrollment will continue until they disappear from the scene.
Table 1
|
|
Count of Private Colleges for Two FTE Groups
|
|
|
2017
|
2018
|
2019
|
2020
|
2021
|
2022
|
2023
|
2024
|
|
FTE<1000
|
233
|
232
|
241
|
246
|
263
|
270
|
285
|
292
|
|
FTE>=1000
|
709
|
710
|
701
|
696
|
679
|
672
|
657
|
650
|
|
Total
|
942
|
942
|
942
|
942
|
942
|
942
|
942
|
942
|
Table 2
|
|
Change in Count of Private Colleges for Two FTE Groups
|
|
2018
|
2019
|
2020
|
2021
|
2022
|
2023
|
2024
|
|
FTE<1000
|
-1
|
9
|
5
|
17
|
7
|
15
|
7
|
|
FTE>=1000
|
1
|
-9
|
-5
|
-17
|
-7
|
-15
|
-7
|
|
Total
|
0
|
0
|
0
|
0
|
0
|
0
|
0
|
Chart 1
Dealing with the Financial Challenges of the Demographic Bust
Colleges that are living on the slender thread of survival must begin immediately to make deep strategic changes if they want to stop the slide into financial distress. Here are several suggestions:
- Boards must clearly inform employees that the president’s strategic and operational changes are strongly supported.
- Cut the employee headcount; nearly 70% of operational costs involve the cost of employee compensation.
- Cut non-productive operational expenditures.
- Cut non-productive academic programs where the costs are greater than the tuition revenue produced by the programs.
- Consolidate offices, classrooms, and residence halls. Savings include – utilities, insurance, security, and maintained. Sell buildings that are closed.
- Bargain with lenders to reduce interest rates or forgive debt.
- Keep lenders from calling loans because the college has violated covenants.
- Arrange with the proper governmental officials to borrow from the endowment.
- Stop expanding tuition discounts because they are probably counterproductive; i.e., increased discounts are not generating enough enrollment revenue to offset the discount.
- Select revenue strategies that can be implemented quickly and have a strong chance of success.
- Do not choose small revenue strategies like a museum or small academic programs that will attract too few students.
- Figure out what your college does better than your competitors and advertise the advantages of enrolling at your college.
- Fine tune your academic program to be better than your competition.
- Get the name of your college in the eye of the public as often as possible. Work hard to get out good news because there will be lots of bad news.
- Don’t dawdle, time is scarce and get in command of the situation before financial distress overwhelms all strategic options.
Note about the data set used in the study:
The data set includes 44 private colleges from IPEDS for the period 2017 to 2024 that offered a four-year degree subject to these exclusions because they have different business models: seminaries, yeshivas, art and music schools, research colleges, and colleges with missing data. The last year for the data is 2024; This set of colleges was split into two enrollment groups: FTE < 1,000 students and FTE >= 1,000 students. The data was then averaged for the two groups for each variable by year. The first chart has the basic data trend for both sets of private colleges, and the next two charts show the linear and a second-degree polynomial trend, i.e., a quadratic equation.
Editorial Assistance by Jack Corby, Vice-President of Stevens Strategy
-
Josh Moody (February 26, 2026); (Retrieved February 24, 2026) “Survey: What Presidents Really Think”; Inside Higher Education; What college presidents are thinking about in 2025. ↑
by Michael K. Townsley | Mar 7, 2026 | Private Colleges & Universities in Crisis
Slender Thread – 1
FTE Enrollment Trend from 2018 to 2024
The Slender Thread refers to the sources of financial resources needed by private colleges and universities to survive the upcoming demographic cliff. There will be five Slender Threads in this series. The order is: 1 – Enrollment Trends, 2 – Relationship of Tuition Discounts to Enrollment, 3 – Effect of Changes in Enrollment on Unrestricted Funds, 4 – Change in Total Net Assets, and 5 – Basic Survival Rules for Slender Threads.
This study used IPEDs data from 2017 to 2024 to compute the enrollment to unrestricted net asset ratio for 944 private colleges. This set of colleges was split into two enrollment groups: FTE < 1,000 students and FTE >= 1,0000 students. The data was then averaged for the two groups for each variable by year. The first chart has the basic data trend for both sets of private colleges, and the next two charts show the linear and a second-degree polynomial trend, i.e., a quadratic equation.
Slender – 1 covers the change in FTE enrollment for a set of 944 private colleges that are split into two FTE enrollment groups: FTE < 1000 and FTE >= 1,000. Changes in FTE enrollment is a critical factor for most private institutions because most of their revenue is generated from enrollment.
Chart 1 clearly shows that FTE enrollment in the small college group (FTE< 1,000) started to fall in 2016, then took a small jump in the latter stages of the COVID pandemic. After 2021, changes in FTE enrollment for small colleges resumed their steady decline through 2024 with a slight moderation of the rate between 2023 and 2024.
_______________________________
- The data set includes 44 private colleges from IPEDS for the period 2017 to 2024 that offered a four-year degree subject to these exclusions because they have different business models: seminaries, yeshivas, art and music schools, research colleges, and colleges with missing data. The last year for the data is 2024; This set of colleges was split into two enrollment groups: FTE < 1,000 students and FTE >= 1,000 students. The data was then averaged for the two groups for each variable by year. The first chart has the basic data trend for both sets of private colleges, and the next two charts show the linear and a second-degree polynomial trend, i.e., a quadratic equation. ↑
Chart 1
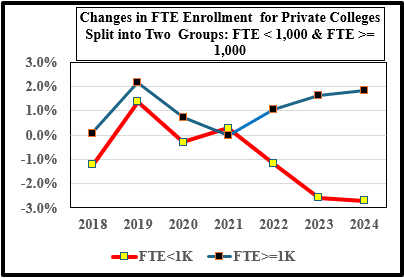
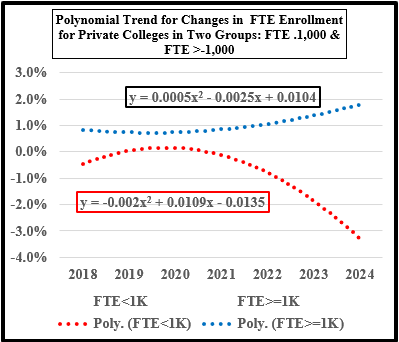
Charts 2 and 3 provide added support that small colleges have had a trying time stemming enrollment decline since 2018 except for the anomaly of 2021. It does not require a complicated analysis to suggest that small colleges will face tremendous pressure to keep their head above water during the impending demographic cliff after 2026. These three enrollment charts clearly show that delaying strategic change could doom the college given that most small colleges are heavily dependent on tuition revenue to survive.
Chart 2
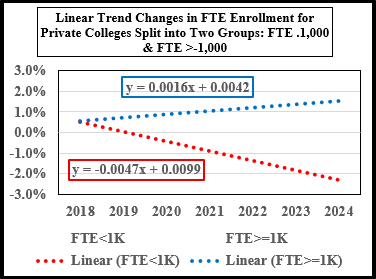
Chart 3
Editorial Assistance by Jack Corby, Vice-President of Stevens Strategy.