by Michael K. Townsley | Apr 25, 2026 | Private Colleges & Universities in Crisis
The Hechinger Report just published a study contending that “More Than 25% of Private Colleges Are at Risk of Closing.” This is a must read for every private college president and board member. Are you on the Hechinger List? Here is the citation: As one Vermont college finishes its last semester, a new projection shows that 442 more are at similar risk .
I, also, found the same potential for deep financial distress for private colleges in an analysis of 994 private colleges conducted three years ago.
The findings showed that 51 (5.4%) colleges faced a very high risk of closing within three years. These colleges had enrollments of less than 1,000 FTE students. Another 242 (25.5%) private colleges had a risk score placing them at great risk of closing within between three and six years. This risk band included colleges with enrollments between 1,000 and 2,000 FTE.
The analysis employed a Vulnerability Gauge based on a two variable logit regression that had an 86.3% prediction rate. The model used IPEDS data from the five-year period ending in 2024. My speculation is that as the slope of the demographic cliff increases many of the ‘great risk’ colleges will slide into the ‘high risk’ category.
The Hechinger Report and the Vulnerability Gauge need to be taken seriously by presidents and boards of trustees of private colleges. The window for taking strategic action will shrink quickly as each semester passes-by. When a college enters the Spring budget season, and if its risk continues to grow because enrollment and cash reserves are falling precipitously, the well-known strategy of ‘kicking the can down the road’ will no longer work. Under this strategy, the college could discover, all too soon, that the college has little or no financial reserves available to put an effective strategy into place.
by Michael K. Townsley | Apr 25, 2026 | Private Colleges & Universities in Crisis
The Wall Street Journal’s story about the struggles of St. Michael’s College is a must read for anyone who wants to understand the problems faced by colleges today and over the next decade. Ten years ago, no one would have believed that St. Michael’s would face long-term declines in enrollments and serial deficits. Now, it is, and its story is not an uncommon story for many colleges throughout the country.
Here is the citation: The Small Private Colleges Dying in a Winner-Take-All University Marketplace – WSJ
by Michael K. Townsley | Apr 25, 2026 | Private Colleges & Universities in Crisis
When Cutting Corners Becomes the Norm
Airlines, aircraft safety analysts, and organizational effectiveness managers use ‘normalizing operational deviance’ to describe when someone consistently violates policies and procedures until it becomes a standard method of operations. This concept often comes up when the National Transportation Safety Board (NTSB) reports on airplane accidents that were due to pilot negligence in not following standard procedures. For example, when a pilot in landing or take-off and makes too sharp a turn leading to a wing stall and the plane crashes. Another cases, is when an inexperienced private pilot fails to follow standard procedures during bad weather when landing at a busy commercial airport and crashes.
Non-aviation organizations are also susceptible to ‘normalizing operational deviance’, but there outcomes may not be as catastrophic as a plane wreck. Nevertheless, failing to follow procedures can result in strategic failures, overspending, violation of debt conditions, or significant accreditation problems.
Here are several examples of ‘normalizing deviance’ in colleges.
- Academic programs that do not closely monitor transcripts, which results in students graduating without earning the required credits. Both financial auditors and accreditors may catch this problem, and they can require the colleges to tell graduates that they did not accumulate sufficient credits to graduate and will then have to return to earn the missing credits. This is a very messy business because graduates do not want to return to classes, and they do not want to pay for the college’s mistake.
- President and chief academic officers that fail to develop rigorous operational plans to implement college strategies, which results in strategic expectations being dashed because critical steps were never taken. Over time, the chief leadership of the college assumes that all is well with their strategies until the plans fail leaving the college in deep financial and academic distress.
- Business offices too often pay for the purchases made by college employees who did not follow standard approval procedures. These unauthorized purchases can grow to a point where they lead to large budget over-runs. An unfortunate aspect of unauthorized purchases is that they distort budget and strategic plans by diverting financial resources to serve the interest of a department or an employee and not the college. By normalizing this deviant behavior, colleges are often surprised to discover that these unauthorized purchases are hard to control and can quickly deplete cash reserves.
- Equipment purchases are not tracked by the business office, which can lead to the loss of costly items. These losses often are not recognized until a fixed asset audit is conducted
- In some cases, presidents and chief buildings officers do not hire an independent construction manager to monitor construction so that the college can save money. The result is that they depend on the contractor to honestly follow speciation’s and regulations. If mistakes occur, material and design specifications are not followed, or local government building and zonings regulations are ignored, projects are delayed or expensive changes are needed, which result in cost overruns of the project. Long-term problems can show-up when equipment, materials, and sub-structures begin to fail. Even if the building is insured, insurance companies may reduce or reject claims because they believe the problems were caused by the negligence on the part of the college.
- IT can be problematic when the system is not set-up for consistent and regular backup, changes are not documented, the system is not updated, or system errors are allowed to linger and are not fixed.
In sum, normalizing operational deviance can lead to complacency, which could result in major system failures.
by Michael K. Townsley | Apr 25, 2026 | Private Colleges & Universities in Crisis
Slender Thread 4 deals with the outcome of the net revenue flows from enrollment to unrestricted net assets and finally to total net assets. The difference between unrestricted net assets and total net assets is that the first holds assets that can be converted to cash, though some unrestricted assets are not easily convertible and may even be devalued at the time of conversion, like receivables, inventory, and short-term assets tied to the bond market.
Net assets are the difference between total assets, which includes unrestricted assets, restricted endowments, and property; and liabilities, which includes bonds, notes, and other long-term loans. Beyond the information that we already have that unrestricted net assets are under stress, the issue is – are total net assets growing or shrinking in value before the full impact of the demographic crash?
Chart 1 displays the change in total net assets between 2018 and 2024. This chart indicates that the six year period was a bumpy ride for small and large colleges. Total assets took their biggest hit in 2023, when the change in these assets took a big drop from large positive change in 2022 to a negative change. As was noted in the discussion on unrestricted net assets in Slender Thread – 3, the large influx of federal funds from COVID loans into unrestricted net assets carried over to total net assets. Then in 2023, the federal spigot closed, and the change in total net assets for small and large colleges dropped like a rock. The change in small college total assets slipped into negative change territory, while large colleges came within kissing distance of the zero-percentage line. In 2024, the change in total net assets bounced positive with small colleges reporting a greater change than did large colleges. Of course, the question remains – was the upward tick in 2024 indicative of long-term change in total net assets or was the change more like the up-down cycle between movements in 2019 and 2023 or the change could have been due to larger investment returns. In other words, will private colleges after 2024 return to the bumpy ride in total net assets that proceeded 2022? Charts 2 and 3 address long-term trends by using a linear and a second order polynomial to smooth the bumpy ride depicted in Chart 1.
Chart 1
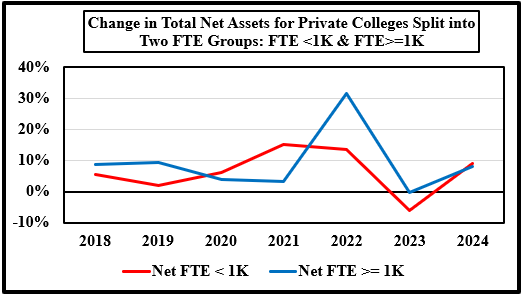
- The data set includes 44 private colleges from IPEDS for the period 2017 to 2024 that offered a four-year degree subject to these exclusions because they have different business models: seminaries, yeshivas, art and music schools, research colleges, and colleges with missing data. The last year for the data is 2024; This set of colleges was split into two enrollment groups: FTE < 1,000 students and FTE >= 1,000 students. The data was then averaged for the two groups for each variable by year. The first chart has the basic data trend for both sets of private colleges, and the next two charts show the linear and a second-degree polynomial trend, i.e., a quadratic equation. ↑
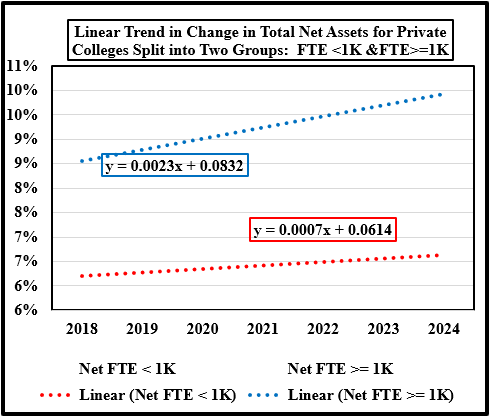
According to the linear trend in Chart 2; both small and large private colleges have a positive slope. However, the slope for small colleges is magnitudes less than the slope for large colleges. The slow rising slope for small colleges raises the question – will the change in the slope of these colleges turn negative and put the them in serious financial distress? Nevertheless, the trend in the rate of change remains above 6% for small colleges, which is a relatively strong trend over time.
Chart 2
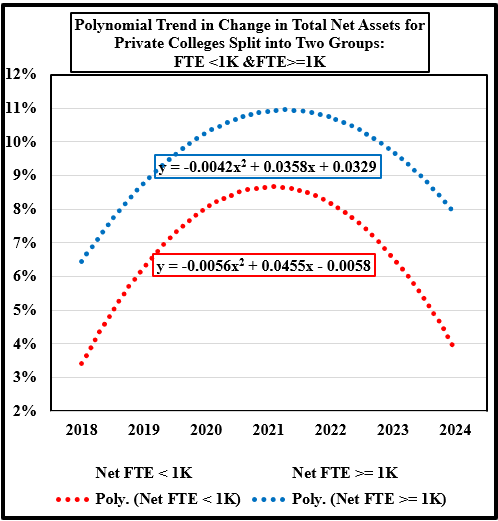
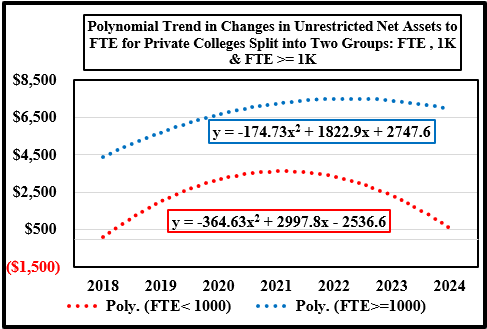
The polynomial trend in Chart 3 provides a different perspective than the linear trend in Chart 2. While the linear trends in Chart 2 iron out the bumps with a rising trend for both college groups, the polynomial trend in Chart 3 depicts a parabolic structure that rises through 2022 for large colleges and through 2021 for small colleges. After those years, the parabola turns down with the depth of descent being greater for small colleges. In either case, the coming sharp downward shift in the high school graduate pools after 2026 will have a profound effect on large and small colleges that will require them to take prudent measures very soon to preserve their financial resources. Since many small colleges are already at or near financial distress levels, then will need to act quickly in the next year to cope with massive losses in revenue.
Chart 3
Editorial Assistance by Jack Corby, Vice-President of Stevens Strategy
by Michael K. Townsley | Apr 25, 2026 | Private Colleges & Universities in Crisis
The Slender Thread blogs consider whether private colleges are producing sufficient financial resources to survive the demographic cliff that is fast approaching. Slender Thread – 3 looks at the relationship between enrollment and unrestricted net assets at 944 private colleges. This issue is important for two reasons: first, enrollment generates the greatest proportion of revenue for most private colleges and universities, and second, the revenue, as student bills are paid either by cash from students or by government grants, unrestricted net assets help fill the colleges cash accounts. These accounts are used to pay: employees, utilities, suppliers, minor maintenance contracts, and other operational expenses. When cash fall below an amount needed to cover payments for three months, a college may be forced to take short-term loans, which carry high interest rates and may have other adverse effects on the budget besides interest costs, which could further increase financial risk in light of the demographic cliff.
Chart 1 uses a simple ratio to estimate the impact of enrollment on unrestricted net assets: (Unrestricted Net Assets / FTE). The first chart illustrates that enrollment at small colleges is barely providing new funds for unrestricted net assets. In addition, the ratio for large colleges was erratic between 2018 and 2024. The data for both small and large colleges resulted in increases in the ratio in 2022 with large colleges showing a larger jump in the ratio. The bump in 2022 was probably due to the large sums pumped into colleges by the federal government to provide relief from the financial ravages caused by closing of most colleges for a year and transferring their students to on-line programs. The quick and unexpected move to online programs forced college to make large technology purchases.
Chart 1
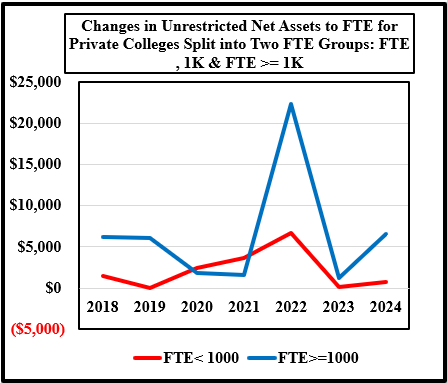
- The data set includes 44 private colleges from IPEDS for the period 2017 to 2024 that offered a four-year degree subject to these exclusions because they have different business models: seminaries, yeshivas, art and music schools, research colleges, and colleges with missing data. The last year for the data is 2024; This set of colleges was split into two enrollment groups: FTE < 1,000 students and FTE >= 1,000 students. The data was then averaged for the two groups for each variable by year. The first chart has the basic data trend for both sets of private colleges, and the next two charts show the linear and a second-degree polynomial trend, i.e., a quadratic equation. ↑
According to the linear trend chart, larger colleges are maintaining strong and positive growth for the ratio. Given that the ratio is unrestricted net assets to FTE, the positive trend could be due to either a smaller FTE denominator or increasing unrestricted net assets. If we go back to the Blog “Slender Thread – 1”, the FTE for larger colleges was increasing between 1% and 2%. Chart 1 clearly shows that the graph line for large colleges declined for the first four years then took a large jump in 2022, probably due to massive inflows of federal funds during the pandemic. The anomalous peak in 2022 may be distorting the linear trend for larger colleges.
The situation for the linear trend for small colleges is similar to the trend for larger colleges, except that the positive slope is much smaller than the slope for large colleges. If we return to Chart, the ratio dropped to $0 dollars in 2019. Then, it began a continuous increase until 2022, with the ratio peaking in 2022. After the trend line declined between 2018 and 2019. It began a slow upward trend until 2022, when a strong upward turn jump took place. The anomalous turn upward turn in 2022 was followed by very little growth through 2024.
Chart 2
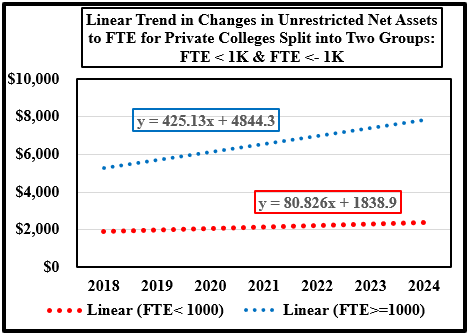
Chart 3 brings clarification for large private colleges by showing that the trend is losing acceleration in 2023 and turning down by 2024. Large colleges will need to pay close attention to the effect of slowing or falling FTE on unrestricted funds.
In the case of small private colleges, Chart 3 clearly shows the downward trajectory for the ratio. The trend for these colleges is speeding toward very dangerous territory, where financial stress will become more evident within the near future as the trend approaches $0 dollars.
Chart 3
Editorial Assistance by Jack Corby, Vice-President of Stevens Strategy.