Slender Thread 2
Are Larger Tuition Discounts Increasing Enrollment?
The Slender Thread blogs look at the capacity of current financial resources to survive the oncoming demographic crash. This blog, Slender Thread – 2, looks at the relationship between changes in tuition and these charts also look at the impact of tuition discounts on enrollment. Economics would suggest that a tuition discount is a price discount that brings demand in alignment with supply. In the case of higher education, demand is enrollment and supply encompasses the courses or programs offered by a college.[1]
Chart 1 uses a simple formula, (change in FTE /change in tuition discounts) to ascertain the relative effectiveness of tuition discounts on enrollment. The chart shows that small colleges, FTE < 1,000), did not having any success using tuition discounts to increase or to even stabilize enrollment in 2024. The relationship between tuition and discounts at large colleges, FTE >= 1,000 fluctuate from year to year. Large colleges reported a steady decline in the effectiveness of tuition discounts between 2019 and 2021 with rising effectiveness in 2022, but effectiveness slid between 2022 and 2024.
Chart 1
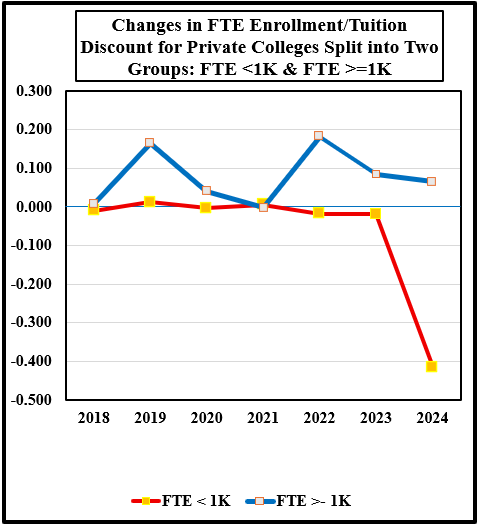
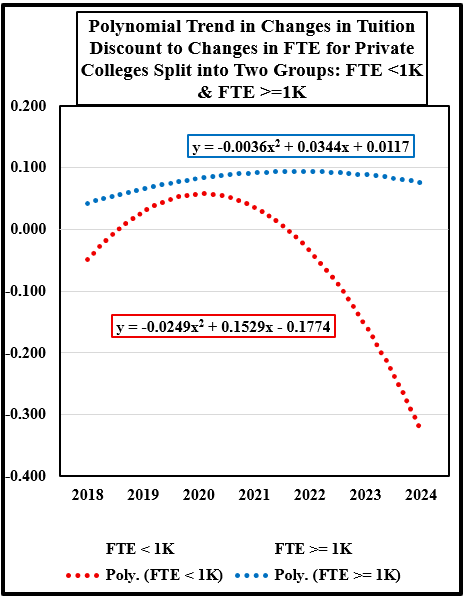
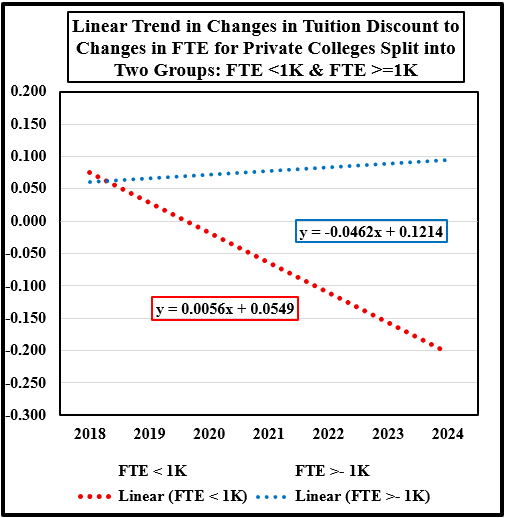 Chart 3 reinforces the comments in Charts 1 and 2, which suggest that tuition discounts are not effective for small colleges. It would be prudent for small colleges to determine whether tuition discounts are providing value to their enrollment strategies. During the demographic crash, many small colleges will find that continuing to increase tuition discounts will reach a point where the flow of cash from tuition for operations expenses be negligible or zero.
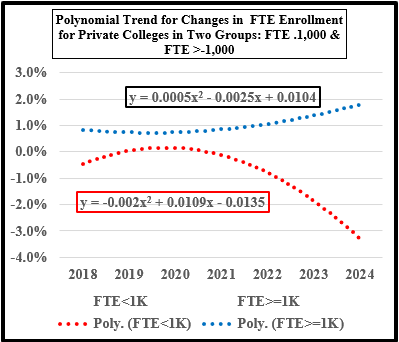
The last chart, also, indicates that some large colleges should assess their validity of their tuition discount strategy because their polynomial trend is starting to turn negative. If that curve continues downward as the impact of the demographic crash approaches, then large colleges will find themselves in the same position as small colleges because their operational cash flows could dramatically shrink.
Both small and large private colleges face some very tough decisions in the near future about the continued use of tuition discounts because discounts have become a presumably reliable strategy to increase revenue without disturbing the flow of cash to reserves. However, this assumption may have lost its usefulness.
Chart 3
Chart 3 reinforces the comments in Charts 1 and 2, which suggest that tuition discounts are not effective for small colleges. It would be prudent for small colleges to determine whether tuition discounts are providing value to their enrollment strategies. During the demographic crash, many small colleges will find that continuing to increase tuition discounts will reach a point where the flow of cash from tuition for operations expenses be negligible or zero.
The last chart, also, indicates that some large colleges should assess their validity of their tuition discount strategy because their polynomial trend is starting to turn negative. If that curve continues downward as the impact of the demographic crash approaches, then large colleges will find themselves in the same position as small colleges because their operational cash flows could dramatically shrink.
Both small and large private colleges face some very tough decisions in the near future about the continued use of tuition discounts because discounts have become a presumably reliable strategy to increase revenue without disturbing the flow of cash to reserves. However, this assumption may have lost its usefulness.
Chart 3
 Editorial Assistance by Jack Corby, Vice-President of Stevens Strategy
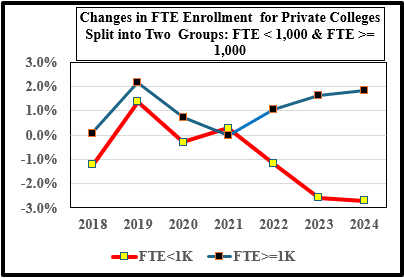
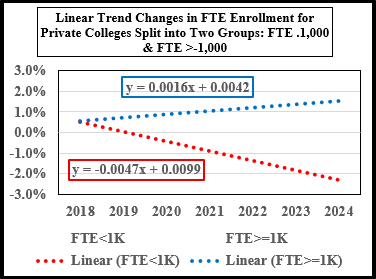
- The data set includes 44 private colleges from IPEDS for the period 2017 to 2024 that offered a four-year degree subject to these exclusions because they have different business models: seminaries, yeshivas, art and music schools, research colleges, and colleges with missing data. The last year for the data is 2024; This set of colleges was split into two enrollment groups: FTE < 1,000 students and FTE >= 1,000 students. The data was then averaged for the two groups for each variable by year. The first chart has the basic data trend for both sets of private colleges, and the next two charts show the linear and a second-degree polynomial trend, i.e., a quadratic equation. ↑
Chart 3 reinforces the comments in Charts 1 and 2, which suggest that tuition discounts are not effective for small colleges. It would be prudent for small colleges to determine whether tuition discounts are providing value to their enrollment strategies. During the demographic crash, many small colleges will find that continuing to increase tuition discounts will reach a point where the flow of cash from tuition for operations expenses be negligible or zero.
The last chart, also, indicates that some large colleges should assess their validity of their tuition discount strategy because their polynomial trend is starting to turn negative. If that curve continues downward as the impact of the demographic crash approaches, then large colleges will find themselves in the same position as small colleges because their operational cash flows could dramatically shrink.
Both small and large private colleges face some very tough decisions in the near future about the continued use of tuition discounts because discounts have become a presumably reliable strategy to increase revenue without disturbing the flow of cash to reserves. However, this assumption may have lost its usefulness.
Chart 3
Editorial Assistance by Jack Corby, Vice-President of Stevens Strategy