The Slender Thread blogs consider whether private colleges are producing sufficient financial resources to survive the demographic cliff that is fast approaching.[1] Slender Thread – 3 looks at the relationship between enrollment and unrestricted net assets at 944 private colleges. This issue is important for two reasons: first, enrollment generates the greatest proportion of revenue for most private colleges and universities, and second, the revenue, as student bills are paid either by cash from students or by government grants, unrestricted net assets help fill the colleges cash accounts. These accounts are used to pay: employees, utilities, suppliers, minor maintenance contracts, and other operational expenses. When cash fall below an amount needed to cover payments for three months, a college may be forced to take short-term loans, which carry high interest rates and may have other adverse effects on the budget besides interest costs, which could further increase financial risk in light of the demographic cliff.
Chart 1 uses a simple ratio to estimate the impact of enrollment on unrestricted net assets: (Unrestricted Net Assets / FTE). The first chart illustrates that enrollment at small colleges is barely providing new funds for unrestricted net assets. In addition, the ratio for large colleges was erratic between 2018 and 2024. The data for both small and large colleges resulted in increases in the ratio in 2022 with large colleges showing a larger jump in the ratio. The bump in 2022 was probably due to the large sums pumped into colleges by the federal government to provide relief from the financial ravages caused by closing of most colleges for a year and transferring their students to on-line programs. The quick and unexpected move to online programs forced college to make large technology purchases.
Chart 1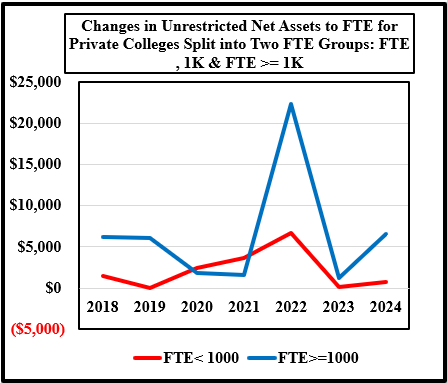
- The data set includes 44 private colleges from IPEDS for the period 2017 to 2024 that offered a four-year degree subject to these exclusions because they have different business models: seminaries, yeshivas, art and music schools, research colleges, and colleges with missing data. The last year for the data is 2024; This set of colleges was split into two enrollment groups: FTE < 1,000 students and FTE >= 1,000 students. The data was then averaged for the two groups for each variable by year. The first chart has the basic data trend for both sets of private colleges, and the next two charts show the linear and a second-degree polynomial trend, i.e., a quadratic equation. ↑
According to the linear trend chart, larger colleges are maintaining strong and positive growth for the ratio. Given that the ratio is unrestricted net assets to FTE, the positive trend could be due to either a smaller FTE denominator or increasing unrestricted net assets. If we go back to the Blog “Slender Thread – 1”, the FTE for larger colleges was increasing between 1% and 2%. Chart 1 clearly shows that the graph line for large colleges declined for the first four years then took a large jump in 2022, probably due to massive inflows of federal funds during the pandemic. The anomalous peak in 2022 may be distorting the linear trend for larger colleges.
The situation for the linear trend for small colleges is similar to the trend for larger colleges, except that the positive slope is much smaller than the slope for large colleges. If we return to Chart, the ratio dropped to $0 dollars in 2019. Then, it began a continuous increase until 2022, with the ratio peaking in 2022. After the trend line declined between 2018 and 2019. It began a slow upward trend until 2022, when a strong upward turn jump took place. The anomalous turn upward turn in 2022 was followed by very little growth through 2024.
Chart 2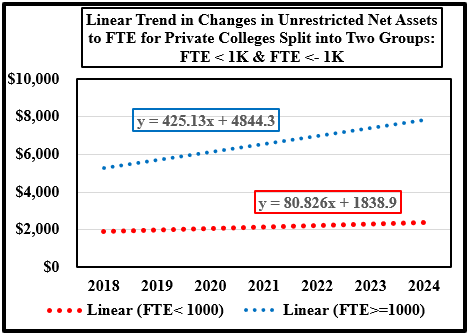
Chart 3 brings clarification for large private colleges by showing that the trend is losing acceleration in 2023 and turning down by 2024. Large colleges will need to pay close attention to the effect of slowing or falling FTE on unrestricted funds.
In the case of small private colleges, Chart 3 clearly shows the downward trajectory for the ratio. The trend for these colleges is speeding toward very dangerous territory, where financial stress will become more evident within the near future as the trend approaches $0 dollars.
Chart 3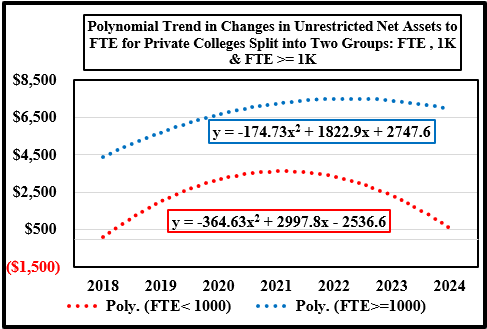
Editorial Assistance by Jack Corby, Vice-President of Stevens Strategy.