Slender Thread 4 deals with the outcome of the net revenue flows from enrollment to unrestricted net assets and finally to total net assets. The difference between unrestricted net assets and total net assets is that the first holds assets that can be converted to cash, though some unrestricted assets are not easily convertible and may even be devalued at the time of conversion, like receivables, inventory, and short-term assets tied to the bond market.
Net assets are the difference between total assets, which includes unrestricted assets, restricted endowments, and property; and liabilities, which includes bonds, notes, and other long-term loans. Beyond the information that we already have that unrestricted net assets are under stress, the issue is – are total net assets growing or shrinking in value before the full impact of the demographic crash?
Chart 1 displays the change in total net assets between 2018 and 2024.[1] This chart indicates that the six year period was a bumpy ride for small and large colleges. Total assets took their biggest hit in 2023, when the change in these assets took a big drop from large positive change in 2022 to a negative change. As was noted in the discussion on unrestricted net assets in Slender Thread – 3, the large influx of federal funds from COVID loans into unrestricted net assets carried over to total net assets. Then in 2023, the federal spigot closed, and the change in total net assets for small and large colleges dropped like a rock. The change in small college total assets slipped into negative change territory, while large colleges came within kissing distance of the zero-percentage line. In 2024, the change in total net assets bounced positive with small colleges reporting a greater change than did large colleges. Of course, the question remains – was the upward tick in 2024 indicative of long-term change in total net assets or was the change more like the up-down cycle between movements in 2019 and 2023 or the change could have been due to larger investment returns. In other words, will private colleges after 2024 return to the bumpy ride in total net assets that proceeded 2022? Charts 2 and 3 address long-term trends by using a linear and a second order polynomial to smooth the bumpy ride depicted in Chart 1.
Chart 1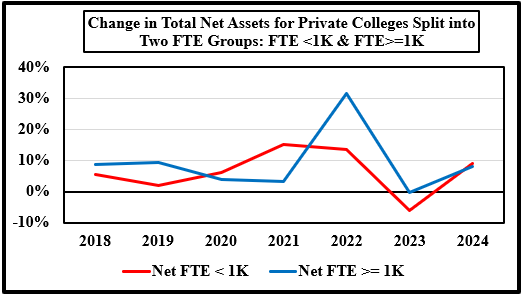
- The data set includes 44 private colleges from IPEDS for the period 2017 to 2024 that offered a four-year degree subject to these exclusions because they have different business models: seminaries, yeshivas, art and music schools, research colleges, and colleges with missing data. The last year for the data is 2024; This set of colleges was split into two enrollment groups: FTE < 1,000 students and FTE >= 1,000 students. The data was then averaged for the two groups for each variable by year. The first chart has the basic data trend for both sets of private colleges, and the next two charts show the linear and a second-degree polynomial trend, i.e., a quadratic equation. ↑
According to the linear trend in Chart 2; both small and large private colleges have a positive slope. However, the slope for small colleges is magnitudes less than the slope for large colleges. The slow rising slope for small colleges raises the question – will the change in the slope of these colleges turn negative and put the them in serious financial distress? Nevertheless, the trend in the rate of change remains above 6% for small colleges, which is a relatively strong trend over time.
Chart 2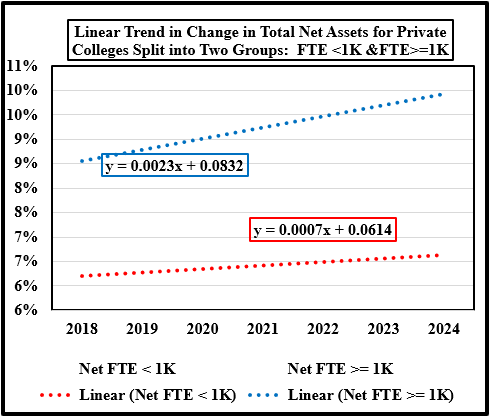
The polynomial trend in Chart 3 provides a different perspective than the linear trend in Chart 2. While the linear trends in Chart 2 iron out the bumps with a rising trend for both college groups, the polynomial trend in Chart 3 depicts a parabolic structure that rises through 2022 for large colleges and through 2021 for small colleges. After those years, the parabola turns down with the depth of descent being greater for small colleges. In either case, the coming sharp downward shift in the high school graduate pools after 2026 will have a profound effect on large and small colleges that will require them to take prudent measures very soon to preserve their financial resources. Since many small colleges are already at or near financial distress levels, then will need to act quickly in the next year to cope with massive losses in revenue.
Chart 3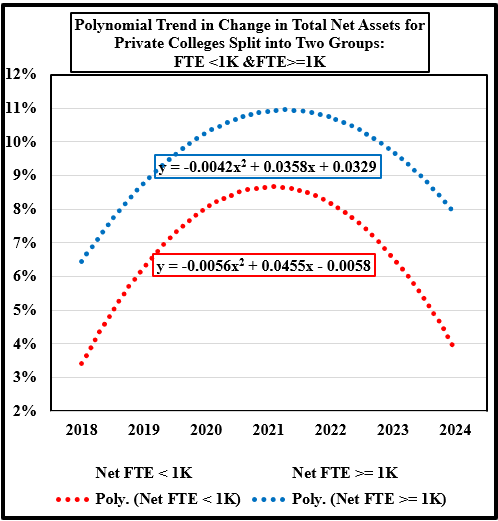
Editorial Assistance by Jack Corby, Vice-President of Stevens Strategy