by Michael K. Townsley | May 10, 2025 | Private Colleges & Universities in Crisis
From: TIPS on Higher Education Leadership
Here are steps boards and presidents can take to stem a downward slide into a major financial crisis due to a depletion of cash reserves:
- Identify why cash reserves are being depleted;
- Are banks threatening to call loans due to violation of covenants?
- Stop all non-essential cash purchases;
- Freeze hiring, except for critical positions needed for ongoing operations, like the chief financial officer and the head of marketing;
- If the endowment has a balance, contact the Attorney General to request state approval for a substantial loan on the endowment. If possible, use the proceeds to pay off loans carrying large payments;
- List all unused or under-utilized property that can be sold.;
- Consolidate classrooms, faculty, staff, and administration in as few buildings as possible. If the empty buildings cannot be sold, mothball them to save operational and maintenance costs;
- Run a ‘Save the College’ fundraising campaign.;
- Eliminate programs or majors with more faculty than students pursuing a major;
- Design new academic programs to generate larger enrollments;
- Control net tuition by ending contracts for enrollment services that charge a hefty fee, as these services reduce cash produced by new students;
- Put construction contracts on hold;
- Hire an attorney with broad and successful experience in higher education. The attorney is needed to defend the college against lawsuits and to review contracts and changes in corporate documents;
- Identify every source of cash, like uncollected receivables, loose cash stored in files, and expensive automobiles that could be replaced with less expensive vehicles. For example, safety patrol cars could be replaced with golf carts.
This brief will be available on the expanded edition in TIPS on Leadership in Higher Education that is coming out in the Summer of 2025. ↑
by Michael K. Townsley | May 10, 2025 | Private Colleges & Universities in Crisis
From: TIPS on Higher Education Leadership
These signs point to major problems that, if not addressed immediately, could lead to the collapse of the college.
- Deficits are growing at double-digit rates;
- Expendable Net Assets to Debt ratio is increasing faster than the median national and regional ratios;
- Cash reserves will not cover the next payroll;
- Vendors are not being paid;
- Banks will not make short-term loans;
- Accreditors have warned the college that it will lose accreditation at the end of the academic year.
- When the Burnout Score© is computed, if it is less than 1, it indicates a high probability of failure within a year.
- The board of trustees miss signals that the college faces a financial catastrophe.
- The board needs to receive sufficient and accurate information about the financial condition of the college.
- Cash reserves are less than two months, and the next federal tranche is not expected to arrive until after cash is exhausted.
- Over-collateralization of property eliminates the college’s flexibility of selling property for cash.
- Handbook rules that prevent an immediate reduction-in-force plan or lead to ambiguity over who has decision authority over academic matters.
- Third-party enrollment contracts in which a contractor receives a portion of the tuition and fees from new students. A college with a high tuition discount rate, and if it is combined with the contractor’s rate, can find that it receives little or no cash out of new student tuition. For example, here is a case where a college discount has a discount rate of 75% and contracts with an enrollment agency that charges 25% of new student tuition revenue; this college will only receive 5% of new student revenue.
- Buildings that are empty and have been financed by loans. These buildings are a dead weight on the college’s finances.
- Very low student-faculty ratios result in too expensive faculty and insufficient tuition revenue to support their compensation. Even worse, many colleges have low tenure bars that make it challenging to reduce the force or even reduce pay.
- Board meetings fail to have a quorum.
- Neither the president nor the board practices due diligence on plans or contracts.
- Neither the president nor the board involves legal counsel who is experienced in higher education law to vet strategies and operational plans.
- Either the president or the board chair or both publicly announce that they expect the college to close. The result is devastating. New students withdraw their applications, and donors stop giving to the college.
This brief will be available on the expanded edition in TIPS on Leadership in Higher Education that is coming out in the Summer of 2025. ↑
by Michael K. Townsley | May 10, 2025 | Strategic Planning
This paper deals with the trade-off between labor and capital. For the purposes of this paper, labor is defined as compensation (pay and benefits) and capital is defined as plant, equipment, and land assets. In addition, this paper is interested in the trade-off between labor (faculty) and capital (technology). The economic trade-off model suggests the following general rules:
1. Labor can maintain its relative value to capital by possessing a non-replicable set of skills due to their knowledge about their capacity to produce a service, in the case of education, teaching a student.
2. Capital, that is technology, cannot be substituted easily for faculty because their unique knowledge is difficult to replicate the knowledge and special skills to produce a service or an educated student.
3. Capital, technology, as it improves its operational design to deliver education or educational skills, will replace labor.
4. Depreciation is a major issue in comparing the trade-off between labor (faculty) and capital goods (technology). The latter is depreciated while the former is carried at full cost. Although economists may describe the supply of faculty as human capital, they are not treated as such on financial reports. Because faculty are always carried at full costs, financial reports give the impression that given an equal ten-year supply of labor and capital goods, labor will tend to be worth more, which makes investment decisions more problematic.
5. An underlying assumption on trade-offs is that they are fluid and easily made. However, this assumption is violated when regulations or contracts limit the tradeoff. For example, these obstacles to trade-offs are evident in higher education:
- Accreditors often regulate how courses are taught or how programs are delivered;
- Government regulations can constrain the trade-off between faculty and technology;
- Tenure makes it costly to release instructors and replace them with technology;
- College mission statements may require the use of faculty to instruct students;
- Student markets may prefer faculty over technology;
- Donors who would like to maintain traditional instruction and favorite faculty may oppose replacing them with technology.
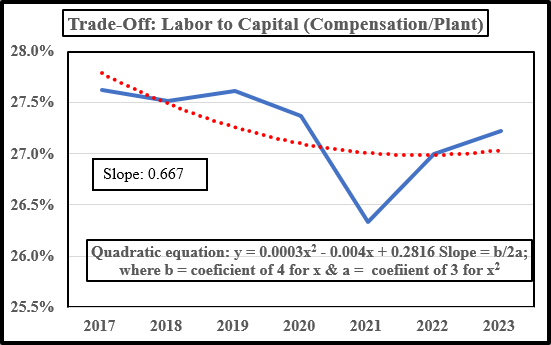
The following table illustrates the current trade-off between compensation and plant. Compensation is a proxy for faculty because of how IPEDS classifies its data. Since IPEDs does not clearly separate faculty compensation or technology, the data uses total compensation and plant, equipment, and material as proxies for labor and capital goods. The table uses a ratio of total compensation to total plant by year.
Starting in 2020, colleges invested more funds in capital goods (plant, etc.) than in labor (compensation). The ratio between compensation and plant fell to its lowest in 2021. The low point occurred during the COVID pandemic in 2021, when colleges made large purchases of technology for faculty and students so that instruction could continue during the pandemic. In 2022, the trade-off began to reverse as colleges either reduced or increased investment in faculty or reduced investment in technology.
The slope of the quadratic equation suggests that the trade-off favored labor after 2022. Whether the claims about the value of AI will reverse the trend will have to be seen.
by Michael K. Townsley | May 10, 2025 | Strategic Planning
Whenever there is a major change in the mission, governance, or operations of a college, the mission statement and by-laws need to be revised and the state regulators and the Internal Revenue Service (IRS) need to be informed. When a college revises its mission and by-laws, the board should have legal counsel review the charges and shepherd the changes through the state government and the IRS. Legal counsel should be recognized for their work in corporate governance.
Mission Statement
The mission statement is usually a part of the corporation papers of the college. The statement succinctly states the purpose of the college, the goals of the college, and the services to be provided.[1] This statement is recorded with corporate documents at the state office that governs corporations.
Most turnaround projects or strategic restructuring likely necessitate a revision of the mission statement because the college has made major changes in the purpose, goals, or services, of the college. When the mission is revised keep the purpose and services broad enough to accommodate future changes.
Before the Board approves the revised mission statement, they should be provided with a line-lime comparison between the current mission and the revised mission. The comparison document should explain the reasons for the changes.
By-Laws
By-laws are the rules and basic procedures for governance of the institution by the board of trustees. The governance statement should not include a dual governance statement, which will only sow confusion and conflict and hinder decision-making.
The by-laws cover: the roles and responsibilities of officers and board member, procedures for meetings, officers, who is eligible to vote, the method of voting, and the schedule of annual and regular meetings.[2] By-laws should be revised when there are significant changes in governance of the college, the services delivered by the college; state or federal laws, to change any of the basic governance rules such as membership and voting.[3]
Liabilities of the Board of Trustees
The board must adhere to e mission statement and by-laws. Otherwise, they could be held liable for deviations from the mission statement and by-laws by the government and by employees, in particular, the faculty. Liability in the form of a law suit by faculty, often occurs when a program is terminated or employees are dismissed because of a reorganization. In order to protect the board and the president, the college should carry directors’ and officers’ insurance. If the college doe not carry this insurance, board members could be personally liable in a law suit.
Board Training
All board members should participate in an annual training session to bring them up-to-date on major legal changes. In addition, the training session should reiterate the basic responsibilities of a board member and the operating policies and procedures of governance. New members should meet with the board chair and president to review responsibilities and expectations of a board member.
-
“Mission Statement” (Retrieved March 15, 2205); Wikipedia; Mission statement – Wikipedia. ↑
-
Board (October 10, 2023); (Retrieved March 15, 2025); How often do Bylaw Need to be Changed; Board; How Often do Bylaws Need to be Updated: Signs and Practices | Ideals Board. ↑
-
Ibid, Board (October 10, 2023); (Retrieved March 15, 2025. ↑
by Michael K. Townsley | May 10, 2025 | Private Colleges & Universities in Crisis

If I is negative and between the range of 0 and – 5, then the college will be in a state of financial distress.
If C and E are negative then change sign of I to negative, regardless of the I score, the college will be in a state of deep financial distress.