by Michael K. Townsley | Sep 26, 2026 | Financial Strategy and Operations
Debt can be more dangerous to financially stressed colleges than unpaid vendors and taxes. The impact of many financial problems can often be postponed through negotiations. However, violation of debt covenants and unpaid debt service cannot be postponed. Debt holders will not accept delays or excuses, Instead, when a college violates its covenants or fails to keep current with debt service payments, debt holders often have the right to immediately call for full-payment on the balance of the principal. Lenders can protect their financial position by forcing a college into bankruptcy.
Negotiating with debt holders is difficult because they want to keep their default rates low to satisfy government regulators and investors. A lender will only delay the draconian step of forcing a college into bankruptcy under this condition.
A credible plan to quickly pay outstanding debt payments and end violations of debt covenants. The tough part of this condition is that the debt holder determines if the plan is credible, and they are not easily satisfied.
If a college is looking for sympathy from debt holders, they will quickly find that there is little or no mercy to be had!
by Michael K. Townsley | Sep 26, 2026 | Tips on Leadership, Uncategorized
The following ten problems might be viewed as unfortunate outcomes of decisions. However, these problems arose because choices were made that led to these problems. The purpose of the list is to assist presidents and board members in recognizing high risk decisions that can have very large adverse effects on the financial stability of a college.
- Loans on top of loans as a college nears a state of financial distress.
- Increasing expenses on the assumption that spending more will bring in more students.
- Marketing the college in the same old way and getting the same old results; not enough students.
- Failing to conduct due diligence on all contracts.
- Running down cash balances without considering how long cash will last.
- Ignoring serial deficits that weaken the college’s capacity to pay for its obligations.
- Ignoring financial factors that will produce scores in the Department of Education Financial Responsibility Test requiring a line-of-credit to continue to receive Title Iv funds.
- Raising discount rates reduces cash generated by tuition revenue that is no longer sufficient to maintain cash reserves.
- A fast-growing list of unpaid bills can endanger the continued operation of a college.
- Delays in payment of federal withholding taxes.
by Michael K. Townsley | Sep 26, 2026 | Private Colleges & Universities in Crisis, Uncategorized
Cash and Trust are imperatives for private college presidents implementing a turnaround strategy. Cash is obvious; no cash – no turnaround. Trust should also be obvious, but it is more nuanced than cash. In a turnaround, a president must be able to trust chief administrators, such as the leaders of academic programs and services, business offices, information technology, plant and maintenance, and the immediate staff of the president’s office. The president must trust these people to carry out turnaround strategies while fulfilling the duties of their office.
However, to paraphrase O.E. Williamson, a noted organizational economist, subordinate leaders may bias their decisions to support their own interests, He also notes that it is extremely expensive to keep opportunism under control because it requires continuous internal auditing and supervision.
Williamson’s proposition is problematic when a president implicitly assumes that they must trust senior. Too often, presidents, in particular, those leading a turnaround face a trap. They need to trust senior leadership to make the right choices because during a turnaround presidents do not have the time to devote to closely overseeing their work. However, opportunism takes no vacation even when a college is trying to survive.
Here are two examples of how implicit trust could be exploited. First, there are senior leaders, who use subterfuge to work against the president’s; so that they can set the stage for the ouster of the president. Second, there is the is senior leader, who believes that they have a better financial strategy than the president. However, this leader’s strategy may deplete funds that the president is counting on for other strategic plans. Third, there is the senior academic leader who stirs up the faculty to encourage a ‘no confidence’ vote. While the vote may have no real effect because the board supports the strategy of the president, the vote will be published in new media and sent to the regional accreditation commission. Theis opportunistic move is like the senior leader, who uses subterfuge to undermine and force the president to be fired. The senior academic leader can also be vying for the position of the president.
If the president is dismissed and both senior leaders either acting or not acting in consort, the issue for both will be who wins the game. If either one is named the president, there is a strong likelihood that both the winner and loser of the presidential contest will immediately fall into conflict. It will be in the interest of the winner to fire the loser, and in the interest of the loser to undermine the winner. This game will have no winners, but there will be a major loser, the chance of saving the college.
by Michael K. Townsley | Sep 26, 2026 | Presidential Leadership
A college is a vast communications network that sends data and information to and from all positions. Some presidents may assume that operational effectiveness requires that they act as the central hub of this network.
Preferably, the presidential hub would deal with policies, delegation follow-up, procedural changes, performance reports, and institutional problems. Usually, presidents avoid delegating monitoring their communication to another person because that person could impose their perspective and biases on what may or not be important to the president.
Monitoring communications is time consuming and can be fatiguing to the president, but during period of institutional stress, they may fear that decisions by other administrators could adversely, affect institutional strategy, policies, and procedures.
The problem with the president acting as the central hub in a college’s communication network is that it can wreak havoc with positional authority and responsibility. The reason for this is simple. Once administrators learn that the president monitors their communications, they will defer to the president as a way to avoid personal risk. As a result, action will be delayed as administrators wait for presidential sanction of decisions at all levels of the college. This central hub practice is about the worse outcome for a college in distress, in particular, financial distress.
by Michael K. Townsley | Sep 26, 2026 | Financial Strategy and Operations
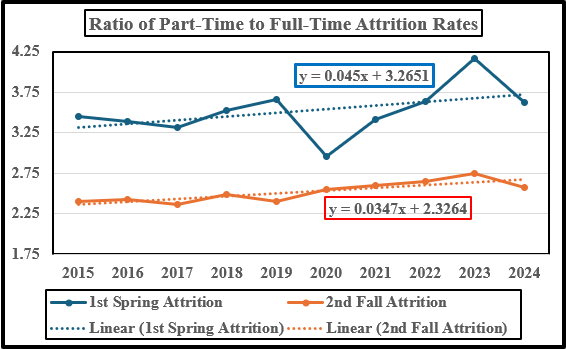
As private colleges move toward enrolling more part-time students, they may discover that their retention rate is much lower than full-time students. Table 1 shows the difference in attrition rates for full and part-time students for the first spring and the second fall of enrollment. By the first spring, the report indicates that more than 25% of part-time students have left the college and by the second fall 50% of those students are no longer enrolled. On the other hand, the attrition rate for full-time students is much lower. Table 1 and Table 2 set out the respective attrition rates and lost tuition revenue for full and part-students.
Table 1
First Spring and Second Fall Attrition Rates for Full and Part-Time Students
|
|
First Spring Attrition
|
Second Fall Attrition
|
|
Full-Time
|
Part-Time
|
Full-Time
|
Part-Time
|
|
2015
|
7.2%
|
24.8%
|
18.8%
|
45.0%
|
|
2016
|
7.4%
|
24.9%
|
19.1%
|
46.2%
|
|
2017
|
7.7%
|
25.6%
|
19.7%
|
46.5%
|
|
2018
|
7.6%
|
26.8%
|
19.7%
|
49.0%
|
|
2019
|
7.7%
|
28.2%
|
20.8%
|
50.0%
|
|
2020
|
9.3%
|
27.4%
|
21.0%
|
53.6%
|
|
2021
|
8.2%
|
27.9%
|
20.1%
|
52.2%
|
|
2022
|
8.1%
|
29.4%
|
20.1%
|
53.1%
|
|
2023
|
7.6%
|
31.7%
|
19.9%
|
54.6%
|
|
2024
|
7.6%
|
27.7%
|
20.2%
|
52.0%
|
|
Average
|
7.8%
|
27.4%
|
19.9%
|
50.2%
|
Table 2
Comparison of Part-Time Lost Students and Tuition Revenue Given Attrition Their Respective Attrition Rates
|
|
Starting Fall Enrolled
|
Retention Rate
|
End of First Semester
|
Retention Rate
|
Net Enrollment
|
Lost Students
|
If Net Tuition is $12,000
|
Lost Revenue First Year
|
|
Full-Time
|
100
|
92%
|
92
|
80%
|
74
|
26
|
$12,000
|
$313,774
|
|
Part-Time
|
100
|
73%
|
73
|
50%
|
36
|
64
|
$12,000
|
$766,142
|
Table 2 is especially instructive of the difficult work that faces private colleges. As they increase part-time students, they could lose more than twice the tuition revenue compared to full-time students. The demographic cliff is enough of a problem for private colleges without contending with lost tuition revenue from part-time enrollment.
The volatility of part-time student enrollments could also distort class scheduling and misallocate other academic resources. Moreover, the marketing cost of enrolling part-time students will be substantially higher if the college expects to match the net revenue of full-time students.
Persistence and Retention Report
U.S. Department of Education, National Center for Education Statistics, Higher Education General Information Survey (HEGIS), “Fall Enrollment in Colleges and Universities” surveys, selected years 1970 through 1985; Integrated Postsecondary Education Data System (IPEDS), “Fall Enrollment Survey” table 303.70
Persistence and Retention Report
National Clearing House Research Center June 25, 2026
Appendix
|
|
National Center for Education Statistics
|
National Clearing House Research Center
|
Differences Between the Two
|
| |
|
|
Full-time
|
Part-time
|
Total
|
Full-Time
|
Part-Time
|
Total
|
Full-Time
|
Part-Time
|
Total
|
|
|
2015
|
8,092,346
|
2,454,866
|
10,547,212
|
409,574
|
16,653
|
426,227
|
7,682,772
|
2,438,213
|
10,120,985
|
|
|
2016
|
8,120,721
|
2,661,510
|
10,782,231
|
413,630
|
16,825
|
430,455
|
7,707,091
|
2,644,685
|
10,351,776
|
|
|
2017
|
8,144,539
|
2,675,726
|
10,820,265
|
430,560
|
16,585
|
447,145
|
7,713,979
|
2,659,141
|
10,373,120
|
|
|
2018
|
8,155,104
|
2,708,304
|
10,863,408
|
441,452
|
17,729
|
459,181
|
7,713,652
|
2,690,575
|
10,404,227
|
|
|
2019
|
8,165,320
|
2,801,508
|
10,966,828
|
432,337
|
17,789
|
450,126
|
7,732,983
|
2,783,719
|
10,516,702
|
|
|
2020
|
8,034,478
|
2,918,401
|
10,952,879
|
404,308
|
22,967
|
427,275
|
7,630,170
|
2,895,434
|
10,525,604
|
|
|
2021
|
7,854,922
|
2,908,810
|
10,763,732
|
431,770
|
20,011
|
451,781
|
7,423,152
|
2,888,799
|
10,311,951
|
|
|
2022
|
7,808,684
|
2,932,814
|
10,741,498
|
429,031
|
22,664
|
451,695
|
7,379,653
|
2,910,150
|
10,289,803
|
|
|
2023
|
8,036,349
|
3,072,885
|
11,109,234
|
431,827
|
24,511
|
456,338
|
7,604,522
|
3,048,374
|
10,652,896
|
|
|
2024
|
8,337,103
|
3,351,875
|
11,688,978
|
427,846
|
21,347
|
449,193
|
7,909,257
|
3,330,528
|
11,239,785
|
|