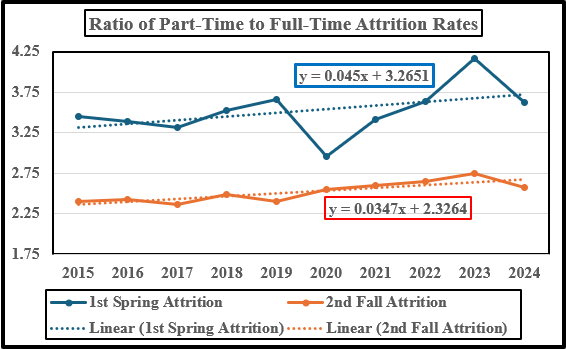
As private colleges move toward enrolling more part-time students, they may discover that their retention rate is much lower than full-time students. Table 1 shows the difference in attrition rates for full and part-time students for the first spring and the second fall of enrollment. By the first spring, the report indicates that more than 25% of part-time students have left the college and by the second fall 50% of those students are no longer enrolled. On the other hand, the attrition rate for full-time students is much lower. Table 1 and Table 2 set out the respective attrition rates and lost tuition revenue for full and part-students.
Table 1
First Spring and Second Fall Attrition Rates for Full and Part-Time Students
|
|
First Spring Attrition |
Second Fall Attrition |
||
|
Full-Time |
Part-Time |
Full-Time |
Part-Time |
|
|
2015 |
7.2% |
24.8% |
18.8% |
45.0% |
|
2016 |
7.4% |
24.9% |
19.1% |
46.2% |
|
2017 |
7.7% |
25.6% |
19.7% |
46.5% |
|
2018 |
7.6% |
26.8% |
19.7% |
49.0% |
|
2019 |
7.7% |
28.2% |
20.8% |
50.0% |
|
2020 |
9.3% |
27.4% |
21.0% |
53.6% |
|
2021 |
8.2% |
27.9% |
20.1% |
52.2% |
|
2022 |
8.1% |
29.4% |
20.1% |
53.1% |
|
2023 |
7.6% |
31.7% |
19.9% |
54.6% |
|
2024 |
7.6% |
27.7% |
20.2% |
52.0% |
|
Average |
7.8% |
27.4% |
19.9% |
50.2% |
Table 2
Comparison of Part-Time Lost Students and Tuition Revenue Given Attrition Their Respective Attrition Rates
|
|
Starting Fall Enrolled |
Retention Rate |
End of First Semester |
Retention Rate |
Net Enrollment |
Lost Students |
If Net Tuition is $12,000 |
Lost Revenue First Year |
|
Full-Time |
100 |
92% |
92 |
80% |
74 |
26 |
$12,000 |
$313,774 |
|
Part-Time |
100 |
73% |
73 |
50% |
36 |
64 |
$12,000 |
$766,142 |
Table 2 is especially instructive of the difficult work that faces private colleges. As they increase part-time students, they could lose more than twice the tuition revenue compared to full-time students. The demographic cliff is enough of a problem for private colleges without contending with lost tuition revenue from part-time enrollment.
The volatility of part-time student enrollments could also distort class scheduling and misallocate other academic resources. Moreover, the marketing cost of enrolling part-time students will be substantially higher if the college expects to match the net revenue of full-time students.
Persistence and Retention Report
|
National Student Clearinghouse: Persistence and Retention |
||
|
Retention if they remain at their institution of initial enrollment |
||
U.S. Department of Education, National Center for Education Statistics, Higher Education General Information Survey (HEGIS), “Fall Enrollment in Colleges and Universities” surveys, selected years 1970 through 1985; Integrated Postsecondary Education Data System (IPEDS), “Fall Enrollment Survey” table 303.70
Persistence and Retention Report
National Clearing House Research Center June 25, 2026
Appendix
|
|
National Center for Education Statistics |
National Clearing House Research Center |
Differences Between the Two |
|||||||
|
|
Full-time |
Part-time |
Total |
Full-Time |
Part-Time |
Total |
Full-Time |
Part-Time |
Total |
|
|
2015 |
8,092,346 |
2,454,866 |
10,547,212 |
409,574 |
16,653 |
426,227 |
7,682,772 |
2,438,213 |
10,120,985 |
|
|
2016 |
8,120,721 |
2,661,510 |
10,782,231 |
413,630 |
16,825 |
430,455 |
7,707,091 |
2,644,685 |
10,351,776 |
|
|
2017 |
8,144,539 |
2,675,726 |
10,820,265 |
430,560 |
16,585 |
447,145 |
7,713,979 |
2,659,141 |
10,373,120 |
|
|
2018 |
8,155,104 |
2,708,304 |
10,863,408 |
441,452 |
17,729 |
459,181 |
7,713,652 |
2,690,575 |
10,404,227 |
|
|
2019 |
8,165,320 |
2,801,508 |
10,966,828 |
432,337 |
17,789 |
450,126 |
7,732,983 |
2,783,719 |
10,516,702 |
|
|
2020 |
8,034,478 |
2,918,401 |
10,952,879 |
404,308 |
22,967 |
427,275 |
7,630,170 |
2,895,434 |
10,525,604 |
|
|
2021 |
7,854,922 |
2,908,810 |
10,763,732 |
431,770 |
20,011 |
451,781 |
7,423,152 |
2,888,799 |
10,311,951 |
|
|
2022 |
7,808,684 |
2,932,814 |
10,741,498 |
429,031 |
22,664 |
451,695 |
7,379,653 |
2,910,150 |
10,289,803 |
|
|
2023 |
8,036,349 |
3,072,885 |
11,109,234 |
431,827 |
24,511 |
456,338 |
7,604,522 |
3,048,374 |
10,652,896 |
|
|
2024 |
8,337,103 |
3,351,875 |
11,688,978 |
427,846 |
21,347 |
449,193 |
7,909,257 |
3,330,528 |
11,239,785 |
|